Gold And Silver Don't Blink! Purely A Mental Game Right Now
Commodities / Gold and Silver 2013 Jun 29, 2013 - 12:32 PM GMTBy: Michael_Noonan
 "Water, water everywhere, nor any drop to drink."
There is a similar situation with regard to fiat paper everywhere, but not a gold delivery to be made. The delirium cast by central bankers issuing unlimited fiat has kept so many people in a fiat-induced fog, unable to see clearly. The fog has lifted. It is all a game. See the fraudulent scheme for what it is and then fear no more. It is just a matter of time before everything unravels, as it surely is.
The price of gold and silver are closer to a bottom than a top. The QE-Infinity is closer to a top and will collapse under its own "goldless" weight. The PM holders are on the correct side of history. Understand that it has been one of the bigger world scams played by the central bankers, the illuminati who believed themselves untouchable, beyond the scope of comprehension by the non-banking world.
Stop buying into the scheme of the moneychangers. Their time has come, and it is but a matter of time. They are playing with everyone's mind, doing everything possible to destroy the gold/silver markets, committing self-destruction in the process. They are making every attempt to discredit the barbaric metal that cannot be eaten, that pays no dividends, but somehow survives as the most reliable measure of accepted value.
The moneychangers are dragging the faux decline for as long as they can, hoping to wear down the resolve of PM holders. Ask yourself, are you selling your holdings of either gold or silver has price has declined? Will you sell out if gold goes to $1100, silver to $18? If not, then what difference does the current price of gold of silver make? If you are not going to sell, then let the central bankers crush the price as much as they can!
The paper holders are trapped and desperate to extricate themselves, at greater and greater losses. This is the best gift PM buyers and holders could want. Stackers keep stacking. Back up the truck and keep on loading. This is no longer a game of finesse. It is all about the paper rats and central bankers, [not sure if there is a distinction to be made], caught golden[less] handed, cheating everyone possible who believed in the system. The system is breaking down, collapsing under it own misdoings.
Never lose sight of common sense. Price typically drops due to a lack of demand, an oversupply, or a combination of both. Do you believe there is a lack of demand? [The acknowledged world-wide demand being at its highest.] There surely is no oversupply, yet price is at its lowest in almost three years. Logic tells you how the current forces of supply and demand are dysfunctional. They have been replaced by the false supply forces of central bankers. The longer central planners destabilize the natural forces of the market, the greater the ultimate reaction will be in the opposite direction.
Paper gold has no value, at least to those who own it. Well, maybe they believe it has value, but when the time comes to cash in the chits, the holders of paper gold and silver will have their belief system turned upside down. Everyone knows the paper market dwarfs to physical market, and until the paper market shrinks to a level more on par with the physical, the unwinding of huge paper longs will continue.
In the process, those who value the value of owning and holding physical gold and silver will be justly rewarded. The fiat gold, [like all paper] has to vaporize before the rewards for keeping the faith in the physical will come to pass, and at the much higher prices most have been anticipating. The supply/demand relationship will remain dysfunctional for as long as it takes, and until the paper market collapses. With its collapse will come the proverbial golden phoenix rising from the distorted ashes left behind.
Ques of 10,000 Chinese waiting to buy gold; unabated purchases by China, Russia, India, et al, of whatever is available; mining shortages, cost of production over current prices, and whatever other story or fact one can produce does not matter. The course is set, and nothing will change it. Events will just have to play themselves out, regardless of anyone's expectations, hopes, or fears. It may take a month, many months, a year, or maybe even longer. No one knows, as has been so apparent for the past few years.
The illuminati are powerful and control all the money in the West, and every dirty trick will be played, count on it. China, Russia, India, Turkey, the Middle East, et al, are no longer buying what the West has been selling...fiat deceit and lies. Exit stage left, West, however long it takes.
The "reality" of the faux paper market is presented next. All the charts say there is no ending action, yet. Time and price are now the enemy of paper, and a gift for the buyers of physical. Stick with your plan. Your time is coming. Almost all want it to be tomorrow, but that will not be. Just remain firm in the belief that it will be. Gold is truth, truth gold, and that is all ye need to know.
[Apologies to Coleridge and Keats.]
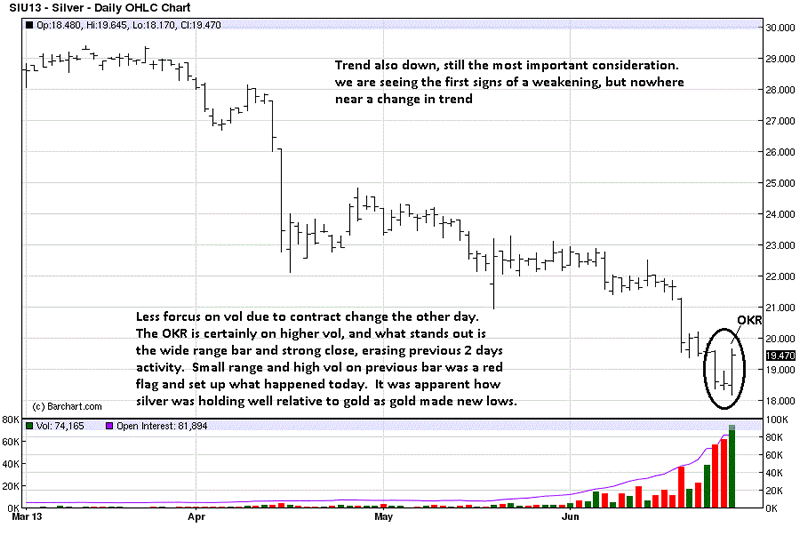
Here is what the charts of paper gold and silver are telling us. Charts do not lie, even though they may only be a chart of [paper] lies.
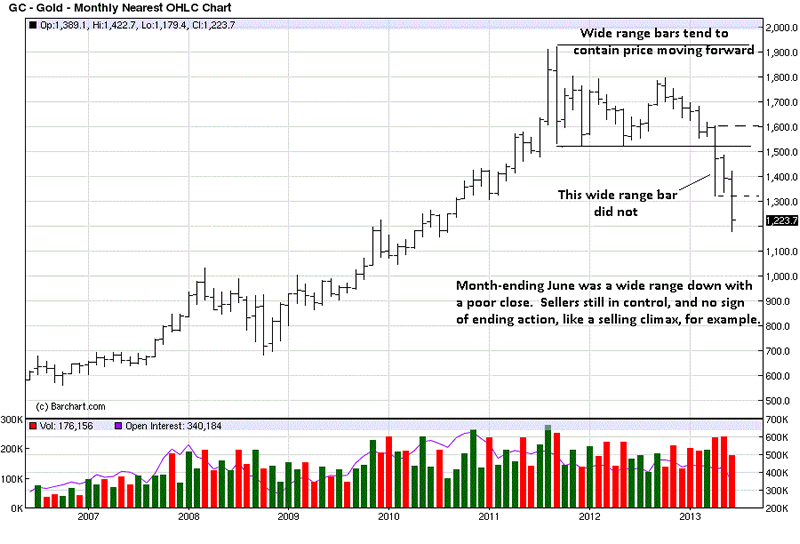
We look for synergy between time frames, but it appears to be changing, as you will see. Wide range bars tend to keep subsequent bars within the high and low of the wide range bar, shown at the top. The second wide range bar, from April 3rd from the right, was also a wide range bar with a close in the middle. The fact that price left that wide range bar so quickly is surprising, and we surmise it reflects the "managing" of price by central banks, unnaturally forcing price lower as fast as possible. We could be wrong, as any guess can be.
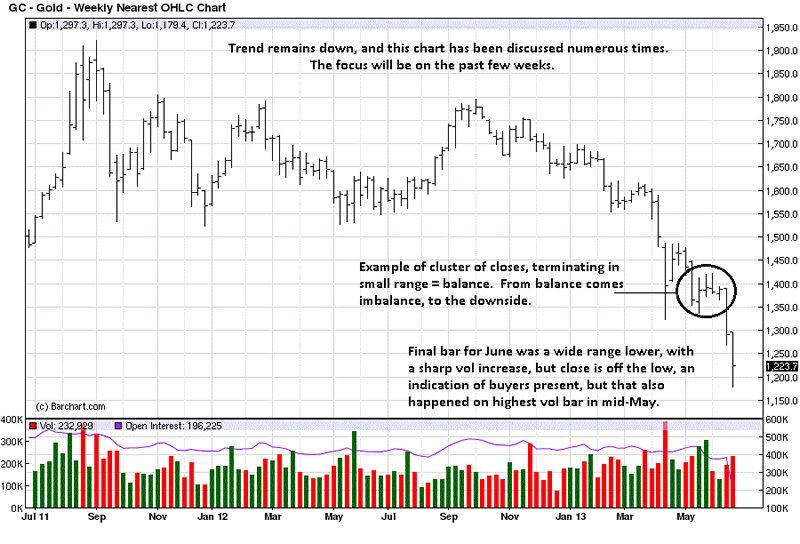
We are of the mind that the charts no longer matter, for they reflect an artificial paper supply side with no accounting for the reality of demand for the physical. What we are looking for now are signs of change, and more focus is placed on current developing market activity. As an aside, we threw in an example of how a clustering of closes is the market's way of sending a message of balance that will lead to imbalance.
The last bar is very interesting. We see it as a subtle sign of possible change. It is explained on the chart, but we need to see more weekly development to confirm or negate our market sense.
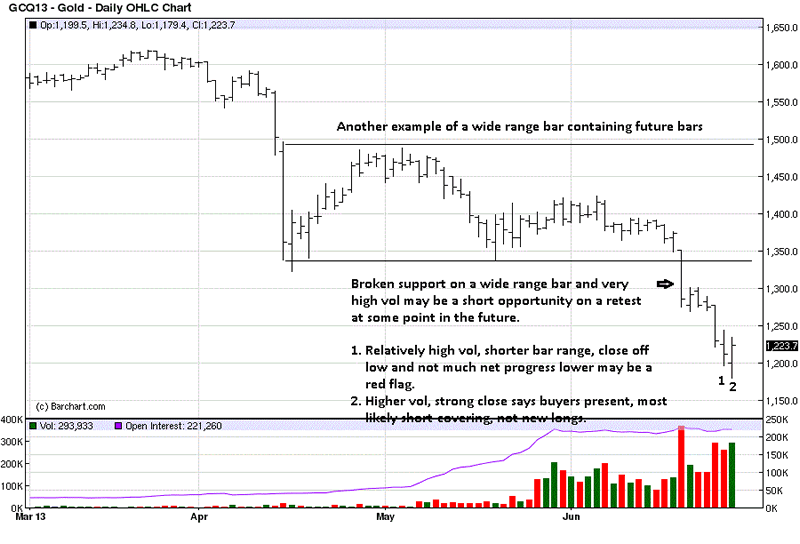
We talked about how a wide range bar contains immediate future activity for some time. Here is one on the daily showing this market behavior, and it is presented in contrast to the monthly April bar, viewed as an anomaly. If, in fact, it were from price being forced lower sooner than normal market activity would have taken, we see it as a positive that the central bankers are becoming more visibly desperate.
The comment on the breaking of support on strong volume is made as a future reference for a potential short. We want to point out that the market is the best source of information. Here is one piece of information that is known today that can possibly affect the outcome of a rally into that area at some future point. The point being, there is no need for any guesswork when deciding to buy/sell, if you have the patience to wait for these edge opportunities.
Where the monthly chart showed no sign of ending action, the daily chart is starting to show possible signs of change, change that can take months, [or longer], to turn this market around. The market provides information like pieces to a puzzle, available for everyone to see, if they look.
We go right to the weekly silver chart next because it is showing clearer signs of potential change. That one single bar, the final bar coming at the very end of the month, 2nd Qtr, end of the first half of the year, is a story in itself. It raises three Red Flags, or warning signs, as explained. Another puzzle piece.
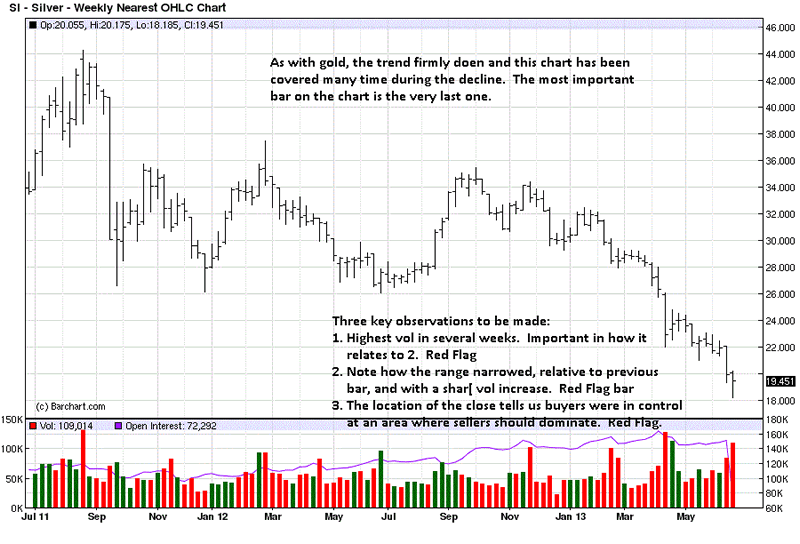
We see definite synergy in the silver time frames, and we took note how well silver not only held but rallied, as gold was pushed lower for a part of the early trading day. It has been relatively weaker than gold, but not on Friday.
This is all taking much longer than many expected. One need not be religious to keep the faith, for the reality of owning the physical will not disappoint. The ultimate facts are on the side of PM holders.
Hold steady, hold fast, keep on adding, and do not blink!
By Michael Noonan
Michael Noonan, mn@edgetraderplus.com, is a Chicago-based trader with over 30 years in the business. His sole approach to analysis is derived from developing market pattern behavior, found in the form of Price, Volume, and Time, and it is generated from the best source possible, the market itself.
© 2013 Copyright Michael Noonan - All Rights Reserved Disclaimer: The above is a matter of opinion provided for general information purposes only and is not intended as investment advice. Information and analysis above are derived from sources and utilising methods believed to be reliable, but we cannot accept responsibility for any losses you may incur as a result of this analysis. Individuals should consult with their personal financial advisors.
Michael Noonan Archive |
© 2005-2022 http://www.MarketOracle.co.uk - The Market Oracle is a FREE Daily Financial Markets Analysis & Forecasting online publication.


