


Stock Market OBV Chart At a Critical Juncture
Stock-Markets / Stock Markets 2013 Aug 21, 2013 - 09:50 AM GMTBy: Brian_Bloom

 There is something very odd about the chart below. To understand what, it is necessary to understand how “On-Balance-Volume” charts are constructed.
Basically, if price rises during the day (today’s close is higher than yesterday’s close) then all volume of that day is treated as buying pressure. Vice versa if price end lower today than it ended yesterday. If price does not change, then volume is ignored. (As an aside, because price can be rigged on a Friday, weekly OBV charts tend to be meaningless)
The OBV chart starts at zero and buying volume is added whilst selling volume is subtracted. The technique was invented and developed by Joe Granville who concluded after years of study that “volume precedes price”. What this means is that buy signals on the OBV chart are likely to show in advance of buy signals on the price chart because “accumulation” will tend to show big volume on the upside and “distribution” will tend to show big volume on the downside. Eventually, the weight of the accumulation or distribution overcomes the propensity of sellers/buyers to sell/buy at a particular price and the price starts to move.
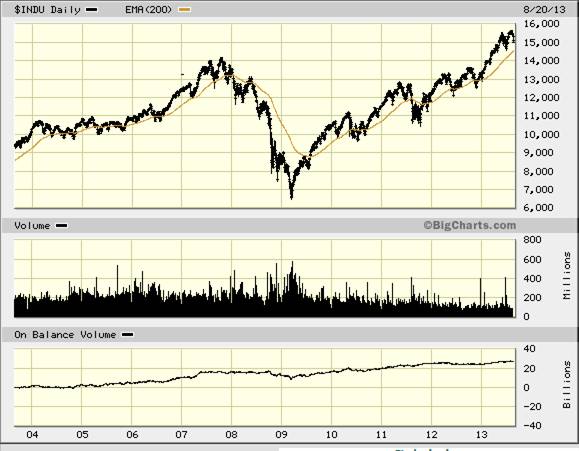
What is extremely odd about the first chart (courtesy Bigchart.com) is that OBV peaked in the first quarter of 2012, when the Dow was around 12,000. Right now, OBV is no higher than it was in Q1 2012 but the Dow is sitting around 15,000. (25% higher).
What this probably means is that price has been ramped up on small volume and this has allowed big volume sales to take place on small price declines without impacting on the upward price trend.
Piercing through the smokescreen, it is fair to draw the conclusion that the equity market has been “rigged” for the past 15 months.
If this is the case (and my analysis has led me to conclude that it has) then a sell signal on the OBV chart will likely be a seriously bearish sign. Why? Because the big players will be less exposed to falls in price and, indeed, may even have positioned themselves to profit from any future falls.
It needs to be recognised that the OBV chart has not yet given a serious sell signal, but it is currently resting on a trend line.
Granville argued that a warning sell signal is given when the OBV saw-tooths to a lower low and the chart below shows a close-up of Dow over the past 6 months:
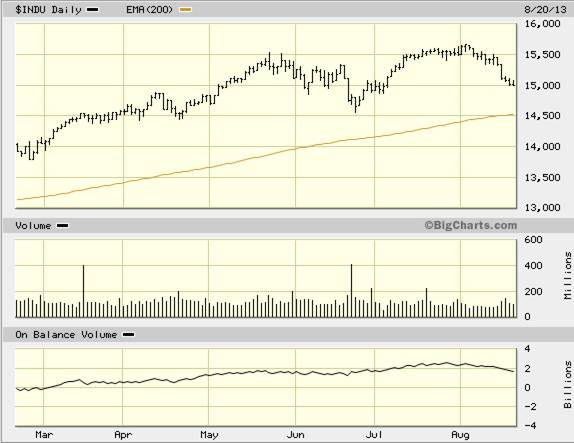
Its early days yet, but in the last six months the OBV chart has never shown two lower lows. In the last couple of weeks we have seen two lower lows.
The longer term OBV chart shows a trend line dating back to 2009. This trend line is still intact, but the OBV is now resting on that trend line. If the trend line is broken (which, if the market has been rigged, will eventually happen) then this will be a sign that selling pressure is overcoming the market’s propensity to absorb the stock.
For the rising trend of Dow Index to remain intact, the OBV chart must bounce up from here. The gold line in the above chart is the 200 day MA and the Dow is still quite far above it.
But the chart below is giving off two warning signals:
1. The Index is below its 45 day MA
2. The 45 day MA has turned down
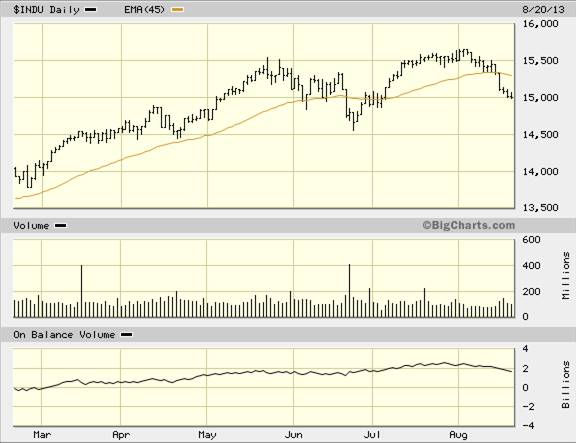
Now, of course, as it did in July, the index could bounce back up again and the 45 day MA could turn up again. But this will require the OBV chart NOT to give a sell signal in the next few days.
By extension, this will require the OBV chart to bounce UP in the next few days.
All “news” is history, but the relevant history of the past few days has been as follows:
· Egypt is moving towards Marshall Law against a background of a significant percentage of the world’s oil shipped through the Suez canal.
· Bond Yields in the US have given a series of “buy” signals (bond prices have given sell signals)
· There has been a subtle shift in attitude of the US towards the acceptability of pre-emptive strike action by Israel against Iran
· The following are the lead stories in “USA Today”

The US media seems to be asleep at the wheel.
Author, Beyond Neanderthal and The Last Finesse
Beyond Neanderthal and The Last Finesse are now available to purchase in e-book format, at under US$10 a copy, via almost 60 web based book retailers across the globe. In addition to Kindle, the entertaining, easy-to-read fact based adventure novels may also be downloaded on Kindle for PC, iPhone, iPod Touch, Blackberry, Nook, iPad and Adobe Digital Editions. Together, these two books offer a holistic right brain/left brain view of the current human condition, and of possibilities for a more positive future for humanity.
Copyright © 2013 Brian Bloom - All Rights Reserved
Disclaimer: The above is a matter of opinion provided for general information purposes only and is not intended as investment advice. Information and analysis above are derived from sources and utilising methods believed to be reliable, but we cannot accept responsibility for any losses you may incur as a result of this analysis. Individuals should consult with their personal financial advisors.
Brian Bloom Archive |
© 2005-2022 http://www.MarketOracle.co.uk - The Market Oracle is a FREE Daily Financial Markets Analysis & Forecasting online publication.