


Gold and Silver, Preparing for the Next Launch to Greater Heights
Commodities / Gold & Silver Apr 09, 2008 - 11:57 AM GMTBy: Peter_Degraaf

 Normally when a commodity rises in price, the supply increases, as producers put their product on the market to take advantage of the higher price. In the case of gold, we see the opposite to that trend. In the year 2000, just before the current bull market in gold began, the world's mines produced 2,573 tonnes. (Some sources quote 2,604 tonnes). In 2007, after gold increased in price from $260.00 to $900.00, the supply of new gold actually DECLINED by 129 tonnes, to 2,444 tonnes. South Africa , historically the world's largest supplier of gold, is now producing the lowest number of ounces in 84 years, and has been overtaken for first place by Red China. (Source www.goldsheetlinks.com ). Gold is scarce, and getting scarcer!
Meanwhile the world's money supply, the medium of exchange that is used to purchase gold, is increasing dramatically. Money supply in over a dozen major economies is increasing at double digit rates.
According to the World Gold Council, demand for gold is running 30% above last year. It's no wonder! While the gold supply is decreasing, the amount of paper and digital money is increasing. It's like going to an auction, where the number of artifacts is limited, and upon entering the auction hall, the auctioneer hands out hundred dollar bills. Guess what is going to happen? Prices will rise!
Slower economic activity in the USA will spill over into other economies, resulting in lower tax revenues. Ironically this will coincide with increased government spending because of the various ‘safety nets' have been put into place. Unfortunately, lower tax revenues combined with increased spending cause a geometric (not arithmetic) rise in budget deficits. We can therefore expect monetary inflation to continue for a long time.
“DETERMINE WHAT IS BEST FOR THE GOVERNMENT AND KNOW THAT IS WHAT THE POWERS ARE WORKING TO MAKE HAPPEN. INFLATION IS WHAT IS ‘BEST' FOR A GOVERNMENT WITH ENORMOUS DEBT” …Ayn Rand.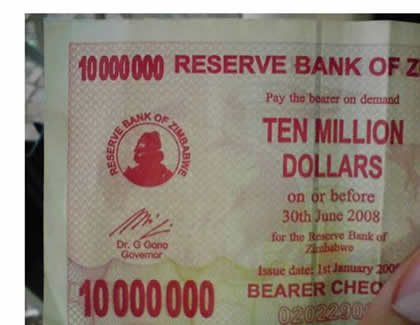
Pictured is a recent 10 million dollar note from Zimbabwe . It even has an expiry date printed on it. What can you buy with this banknote? If you hurry, it might buy a pound of chicken.
RISING GOLD DEMAND.
Gold demand is not limited to jewelry or to investors. The European Union has forced the electronics industry to stop using certain products in assembly and production. Six products can no longer be used, including cadmium and lead. This ruling is affecting every electronic item, including iPods, cell phones, computers, laptops etc., and has forced manufacturers to switch to silver and gold.
Central bankers usually sell gold, when they want to hide the fact that their fiat currencies are becoming ‘worth less' (on the way to becoming worthless). Since gold is the barometer by which the value of fiat currencies can be measured, it is in the interest of money creating banks to keep the gold price from rising. The problem for the central banks is that each time they sell an ounce of gold, they get closer to the day when they will lose control. Already the Canadian Central Bank is virtually ‘out of gold', (having sold 38 billion dollars worth, and using the funds thus acquired, to buy US dollar denominated bills and bonds).
The US gold supply has not been audited since 1953, and the wording describing the gold in custody keeps changing! Originally it was called ‘Gold Bullion Reserves'. Then in 2001 the description was changed to ‘Custodial Gold Bullion'. Six months later the wording was changed again, this time to: ‘Deep Storage Gold'.
Could it be that this refers to gold that is still in the ground, and has yet to be mined?
If that is the case, and since the government does not own any mines, what ominous implications do we draw from that mysterious terminology?
CENTRAL BANK DEMAND.
The Russian Central Bank indicated in 2007, that they wanted to add several hundred tonnes to their reserves. The Chinese Central Bank in 1978 had 95% of its foreign reserves tied up in gold. Today, because of the rapid increase in its foreign reserves (much of it in US dollars), only 1.5% of its assets consist of gold. A number of highly placed officials are on record as stating that they would like to see a change, especially as they notice the decreasing value of the US dollar. Just a small switch on the part of Chinese bankers from dollars to gold will have a very positive impact on the gold price.
Although China is now the world's top gold producer, it is nevertheless a ‘net' importer!
China is buying all of the gold its mines produce plus at least another 25 tonnes per year.
Compared to some other commodities, gold is lagging, and has a lot of potential to rise dramatically. Since the current bull market in commodities began in 2001, oil has risen over 1,000%; copper +500%; lead +600%; Molybdenum +1,100%; Uranium +600%, Platinum 550%; Rhodium +2,000%. Gold thus far has risen less than 400% during this seven year period.
The most powerful ‘driver' for gold is the so-called ‘real interest rate'. This interest rate is arrived at by deducting the rate of inflation from the current T-bill rate. When this formula produces a result of +1% or higher, the ‘real rate' is considered positive, when it produces a result of -1% or lower, the rate is negative.
Chart courtesy Federal Reserve Bank of St. Louis
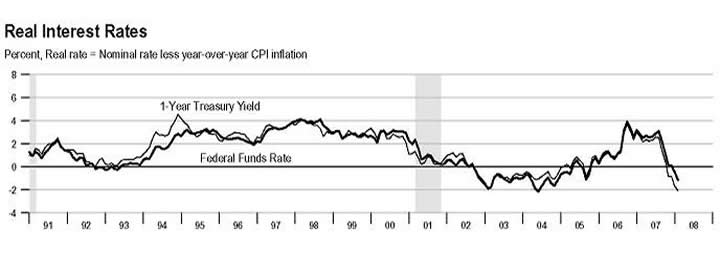
Featured is a chart of ‘real interest rates' using the official CPI rate. Subscribers to my Weekend Report are well aware of the fact that actual consumer prices are much higher than those reported by the government. Thus, if we reconstruct this chart, using the figures reported by John Williams at www.shadowstats.com , then ‘real interest rates' in 2008, are negative by a lot more than -2%!
According to Gibson's Paradox: When ‘real interest rates' fall, gold will rise, and vice versa. This is one of the most completely established empirical facts in the entire field of quantitative economics. Next we'll look at a gold chart to see if Gibson's Paradox is reliable.
Chart courtesy www.stockcharts.com
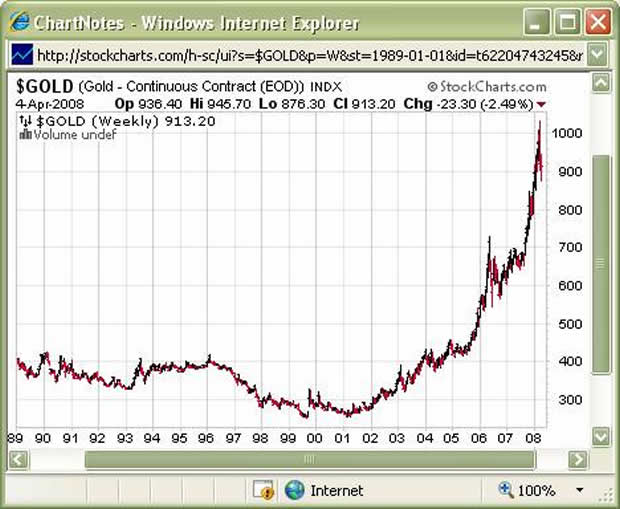
Featured is the gold chart going back to 1989. Real interest rates according to the earlier FED chart, turned positive in 1991, and the gold price dropped. In 1992 real rates fell, and the gold price rose. In 1994 rates rose slightly, and gold was steady. At the end of 1996 rates rose, and gold fell. In 2000 and 2001, real rates started to drop, and by 2002 the rates were negative, and despite desperate efforts on the part of the bank of England , as it sold large quantities of gold, the gold price took off. From 2002 until 2005, real interest rates were negative, and gold kept on rising throughout that period. In 2006 rates turned positive again, and gold corrected for most of that year. In mid 2007 we saw the beginning of the sharpest decline in real rates in almost 20 years. This decline is ongoing, and if we use actual inflation figures, we are probably at -5% . This is incredibly bullish for gold, and provides the ammunition to keep this bull market going for quite a while. Short-term corrections, such as the one that started in March should be viewed as opportunities to add on, not looked upon in fear that the rally is over.
Using past history as our guide, the top we saw in March will likely last anywhere from 1 month to 3 months. The next chart shows us what happened in years past, after a top in the first quarter.
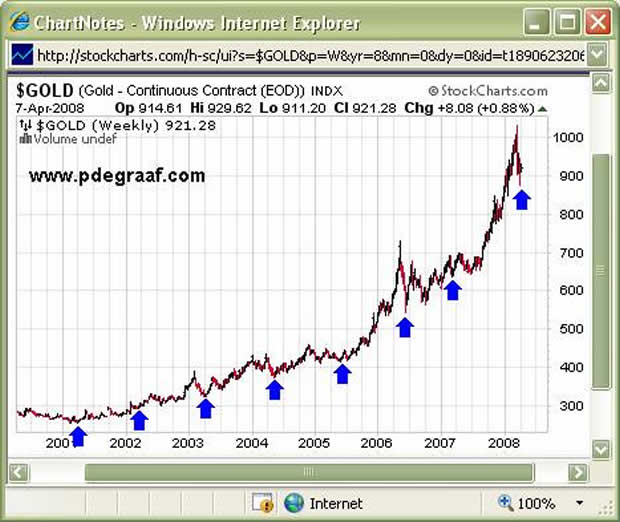
Featured is the 8 year gold chart. The blue arrows point to the lows that were carved out after a top in the first quarter of the year. The worst pull-back occurred in 2006, and you will recall that ‘real interest rates' were positive at that time, pressuring the gold price. The good news for gold bulls is that the March 2008 pull-back has already matched that correction, and although it is possible that gold will drop lower, in view of the fact that ‘real interest rates' are now decidedly negative, one would be foolish to count on prices going much lower.
Large numbers of people who are selling today, may end up buying back at a higher price.
There are a lot of ongoing trends that suggest that the bottom for gold is in place, or very close. Oil, natgas, copper, platinum and grains, along with the HUI gold stocks chart, are all showing signs of having turned back up again, supporting the commodity bull market.
This commodity bull market has a history of swinging in 20 year cycles. Since the current one started in 2001, we need not expect a top for a number of years yet.
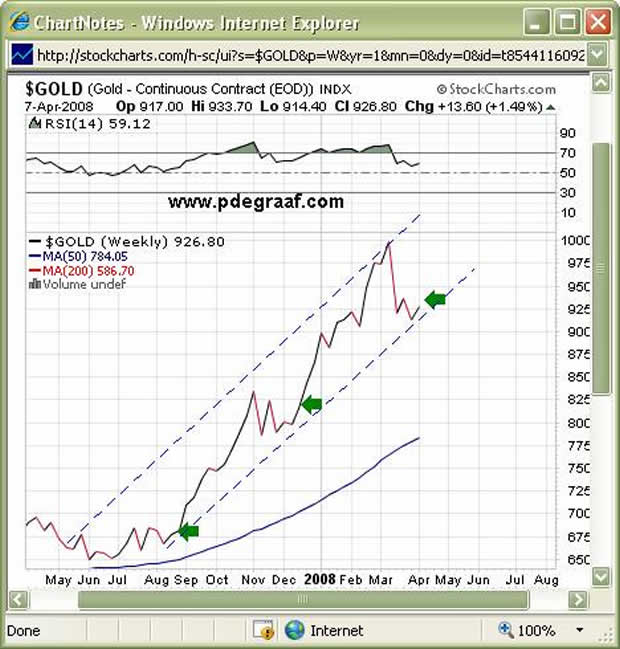
Featured is the weekly gold chart, using closing prices. The green arrows point to the ‘price trigger' where the uptrend resumes, after a pull-back. Notice we are within a ‘hair' of another one of these triggers. This next one will be at 941. Don't be ‘left behind!'
COMPARING GOLD TO SILVER.
The bullish case for gold, that has been made in this article, is even more powerful for silver. Whereas most of the gold that is used, eventually gets recycled, most of the silver that is used, ends up in landfill. Small amounts are used in every cell phone, computer, refrigerator, TV set, laptop, satellite, electrical switches, medical wound coverings, water filters etc.
The 2.5 billion ounces that existed in US government stockpiles when I first became interested in silver in the early 1960's are gone! Used up! Finished!
During the recent drop in silver a few weeks ago, the number of ounces in the SLV, silver ETF actually increased! A very bullish development!
Silver seems to bottom towards the end of each quarter: March, June, September and December often carve out a bottom in silver. The drop in March came right on schedule.
THE RATIO BETWEEN GOLD AND SILVER.
It was my pleasure to meet Mr. Nelson Bunker Hunt at a convention; just after the Comex board changed the rules on silver contracts, and finished his run at silver in early 1980. I asked him about the gold to silver ratio. He told me that he felt that in time, the ratio would shrink to 10 ounces of silver for an ounce of gold.
More than 25 years have passed since that conversation, and many more uses for silver have been discovered. Less and less silver is being found. Due to environmental concerns it is more difficult now to open a mine than at any time in history. (Congress is currently discussing mining legislation HR 2262). It is my belief that the ratio between gold and silver will shrink in time, to 5 ounces of silver buying an ounce of gold.
WHO DO YOU BELIEVE?
A word of advice to those of you who are confused by the different views offered by a myriad of advisors: Keep a simple record of their predictions. Mark the name, the date on which the prediction was made, the nature of the prediction etc. Then keep track of the predictions, and weed out those advisors who are accurate less than 50% of the time, since flipping a coin will give you 50%. You'll soon notice that when a hot-shot analyst tells you that he expects gold to drop $100.00, he is usually back a few days later with a new forecast.
Mr. James Sinclair, the CEO of Tan Range is predicting that gold will rise 80% by early 2011. He is backing this prediction with a 1 million dollar bet. I've listened to Mr. Sinclair speak at one of the New Orleans Seminars. He knows gold! I doubt if he will lose this bet.
EXIT STRATEGY.
We are a long way from having to be concerned about an exit strategy from our gold and silver positions. For those of you who worry about tops, I'll share my exit strategy with you. When 2 ounces of gold or 10 ounces of silver are equal in value to the daily quote for the Dow industrials, I'll start making plans to sell most of my metals, and I'll buy blue chip stocks or real estate with the proceeds. Today the ratio between gold and the Dow is 13.6 ounces of gold or 700 ounces of silver versus the Dow. That is a long way from my exit.
Happy trading!
By Peter Degraaf.
Peter Degraaf is an on-line stock trader, with over 50 years of investing experience. He issues a weekly alert to his subscribers. For a 60 day free trial, send him an E-mail itiswell@cogeco.net , or visit his website www.pdegraaf.com
DISCLAIMER: Please do your own due diligence. I am NOT responsible for your trading decisions.
Peter Degraaf Archive |
© 2005-2022 http://www.MarketOracle.co.uk - The Market Oracle is a FREE Daily Financial Markets Analysis & Forecasting online publication.