


USDCAD Targets New High Above 1.0700
Currencies / Canadian $ Feb 13, 2014 - 03:03 PM GMTBy: Gregor_Horvat

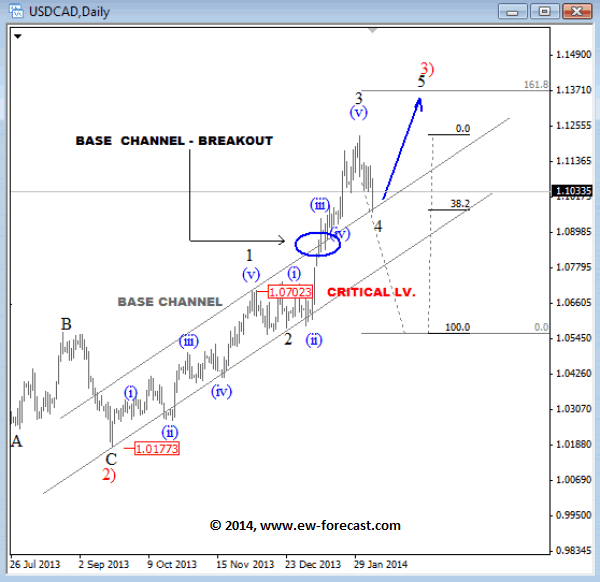
 USDCAD turned south two weeks back from above 1.1200 resistance region where we called end of a wave 3 that is part of an impulsive price action from 1.0170. We know that impulses are five wave pattern, and if we consider that larger trend on this pair is up, then we may suspect that retracement from the highs is probably just another correction within ongoing uptrend. With that said, we labeled a pullback as wave 4 that may send prices up in wave 5 in the next week or two. We expect new high as long as pair trades above 1.0700 invalidation level.
USDCAD Daily Elliott Wave Analysis
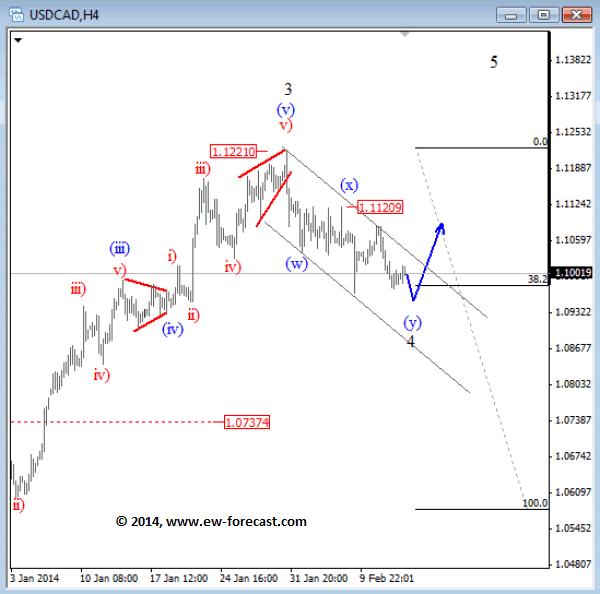
USDCAD Four Hour
USDCAD did not cross 1.1120 resistance yet, so it seems that pair is still moving south within incomplete wave 4. Wave 4 is a corrective leg which can now form a complex correction with 1.0950 test yet to come. From a larger perspective our bias is still bullish because bigger trend is still up, so we expect that sooner or later USDCAD will turn up into wave 5, but 1.1120 break would be needed as confirmation.
USDCAD 4h Elliott Wave Analysis
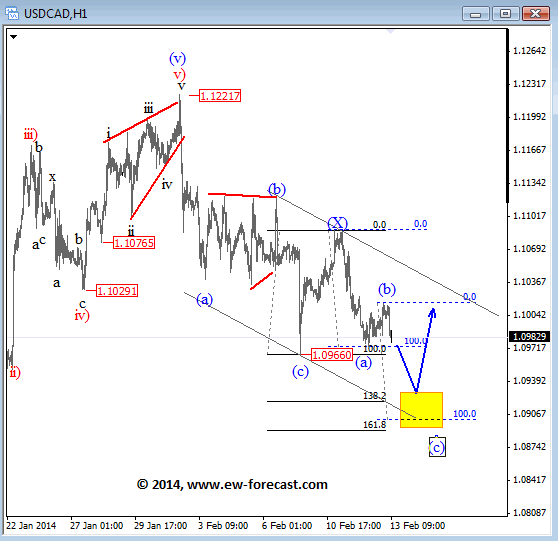
USDCAD One Hour
Another commodity currency that may turn bearish against the USD in coming days is Canadian dollar. On USDCAD price chart we see lower lows and lower highs which is identification of a downtrend, but because of overlapping structure we think that fall will not last long. We see a double zigzag, now moving south in wave (c) final leg in a corrective sequence that may find a support around 1.0900.
USDCAD 1h Elliott Wave Analysis
Written by www.ew-forecast.com | Try our 7 Days Free Trial Here
Ew-forecast.com is providing advanced technical analysis for the financial markets (Forex, Gold, Oil & S&P) with method called Elliott Wave Principle. We help traders who are interested in Elliott Wave theory to understand it correctly. We are doing our best to explain our view and bias as simple as possible with educational goal, because knowledge itself is power.
Gregor is based in Slovenia and has been in Forex market since 2003. His approach to the markets is mainly technical. He uses a lot of different methods when analyzing the markets; from candlestick patterns, MA, technical indicators etc. His specialty however is Elliott Wave Theory which could be very helpful to traders.
He was working for Capital Forex Group and TheLFB.com. His featured articles have been published in: Thestreet.com, Action forex, Forex TV, Istockanalyst, ForexFactory, Fxtraders.eu. He mostly focuses on currencies, gold, oil, and some major US indices.
© 2014 Copyright Gregor Horvat - All Rights Reserved
Disclaimer: The above is a matter of opinion provided for general information purposes only and is not intended as investment advice. Information and analysis above are derived from sources and utilising methods believed to be reliable, but we cannot accept responsibility for any losses you may incur as a result of this analysis. Individuals should consult with their personal financial advisors.
© 2005-2022 http://www.MarketOracle.co.uk - The Market Oracle is a FREE Daily Financial Markets Analysis & Forecasting online publication.