


Why the Next Global Financial Crisis Will Be Unlike Any of the Last 200 Years
Stock-Markets / Credit Crisis 2014 Feb 15, 2014 - 04:01 AM GMTBy: Submissions

 F.F. Wiley writes: Sometime soon, we’ll take a shot at summing up our long-term economic future with just a handful of charts and research results. In the meantime, we’ve created a new chart that may be the most important piece. There are two ideas behind it:
- Wars and political systems are the two most basic determinants of an economy’s long-term path. America’s unique pattern of economic performance differs from Russia’s, which differs from Germany’s, and so on, largely because of the outcomes of two types of battles: military and political.
- The next attribute that most obviously separates winning from losing economies is fiscal responsibility. Governments of winning economies normally meet their debt obligations; losing economies are synonymous with fiscal crises and sovereign defaults. You can argue causation in either direction, but we’re not playing that game here. We’re simply noting that a lack of fiscal responsibility is a sure sign of economic distress (think banana republic).
Our latest chart isolates the fiscal piece by removing war effects and considering only large, developed countries. In particular, we look at government budget balances without military spending components.
(Military spending requires a different evaluation because it succeeds or fails based on whether wars are won or lost. Or, in the case of America’s adventures of the past six decades, whether war mongering policies serve any national interest at all. In any case, military spending isn’t our focus here.)
There are 11 countries in our analysis, chosen according to a rule we’ve used in the past – GDP must be as large as that of the Netherlands. We start in 1816 for four of the 11 (the U.S., U.K., France and Netherlands). Others are added at later dates, depending mostly on data availability. (See this “technical notes” post for further detail.) Here’s the chart:
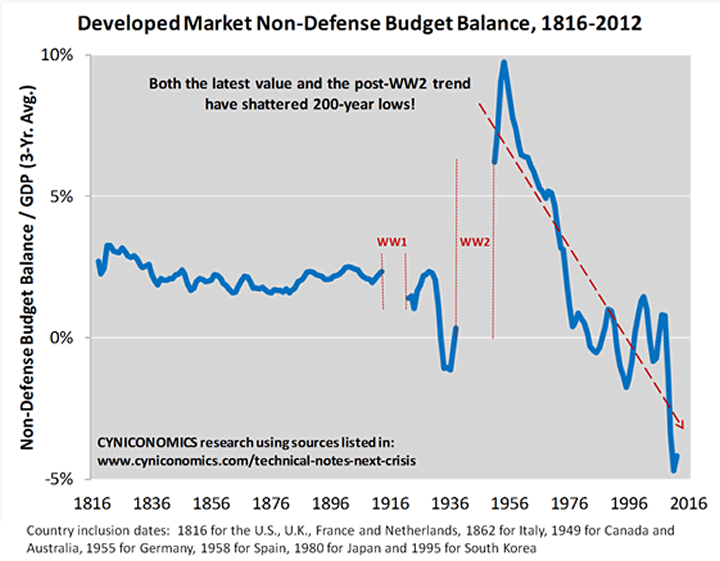
Not only has the global, non-defense budget balance dropped to never-before-seen levels, but it’s falling along a trend line that shows no sign of flattening. The trend line spells fiscal disaster. It suggests that we’ve never been in a predicament comparable to today. Essentially, the world’s developed countries are following the same path that’s failed, time and again, in chronically insolvent nations of the developing world.
Look at it this way: the chart shows that we’ve turned the economic development process inside out. Ideally, advanced economies would stick to the disciplined financial practices that helped make them strong between the early-19th and mid-20th centuries, while emerging economies would “catch up” by building similar track records. Instead, advanced economies are catching down and threatening to throw the entire world into the kind of recurring crisis mode to which you’re accustomed if you live in, say, Buenos Aires.
How did things get so bad?
Here are eight developments that help to explain the post-World War 2 trend:
- In much of the world, the Great Depression triggered a gradual expansion in the role of the state.
- Public officials failed to establish a sustainable structure for their social safety nets, and got away with this partly by sweeping the true costs of their programs under the carpet.
- Profligate politicians were abetted by the economics profession, which was more than happy to serve up unrealistic theories that account for neither unintended consequences nor long-term costs of deficit spending.
- With economists having succeeded in knocking loose the old-time moorings to budgetary discipline (see first 150 years of chart), responsible politicians became virtually unelectable.
- Central bankers suppressed normal (and healthy) market mechanisms for forcing responsibility, by slashing interest rates and buying up government debt.
- Regulators took markets further out of the equation by rewarding private banks for lending to governments, while politicians and central bankers effectively underwrote the private bankers’ risks.
- Monetary policies also encouraged dangerous private credit growth and other financial excesses, resulting in budget-destroying setbacks such as stagflation and banking crises.
- Budget decisions were made without consideration of the inevitability of these setbacks, because economists wielding huge influence over the budgeting process (think CBO, for example) assumed a naïve utopia of endless economic expansion.
Sadly, all of these developments are still very much intact (excepting small improvements in budget projections that we’ll address next week). They tell us we’ll need substantial changes in political processes, central banking and the economics profession to avert the disaster predicted by our chart. And we’re rapidly running out of time, as discussed in “Fonzi or Ponzi? One Theory on the Limits to Government Debt.”
On the bright side, a fiscal disaster should help trigger the needed changes. Every kick of the can lends more weight to the view expressed by some that the debt super-cycle – including public and private debt – needs to go the distance, eventually reaching a Keynesian end game of massive collapse. At that time, we would expect a return to old-fashioned, conservative attitudes toward debt.
As for the chart, it helps to flesh out a handful of ideas we’ve been either writing about or thinking of writing about. We’ll return to it in future posts, including one drilling down to the individual country level that we’ll publish soon.
F.F. Wiley
F.F. Wiley is a professional name for an experienced asset manager whose work has been included in the CFA program and featured in academic journals and other industry publications. He has advised and managed money for large institutions, sovereigns, wealthy individuals and financial advisors.
© 2014 Copyright F.F. Wiley - All Rights Reserved
Disclaimer: The above is a matter of opinion provided for general information purposes only and is not intended as investment advice. Information and analysis above are derived from sources and utilising methods believed to be reliable, but we cannot accept responsibility for any losses you may incur as a result of this analysis. Individuals should consult with their personal financial advisors.
© 2005-2022 http://www.MarketOracle.co.uk - The Market Oracle is a FREE Daily Financial Markets Analysis & Forecasting online publication.