


Dow and Nikkei Stock Market Tops
Stock-Markets / Stock Markets 2014 Apr 08, 2014 - 10:27 AM GMTBy: Dan_Stinson

 Nikkei top and relationship with the DOW - UPDATE - DOW wave (5) top and Nikkei wave (2) top
We issued a newsletter on Feb 17th discussing the possible relationship between the Nikkei and the DOW. The newsletter included charts to illustrate this relationship and suggested that we would see a DOW top while the Nikkei completes wave (2) up. This appears to have occurred on Apr 3 2014 for the Nikkei and on Apr 4 2014 for the DOW. Some of the charts below are from the Feb 17th newsletter.
The DOW appears to have completed wave (5) up while the Nikkei completed wave (2) up.
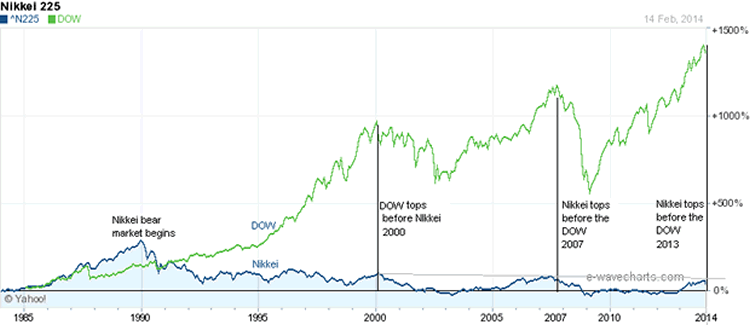
The overlay chart below illustrates that the Nikkei and the DOW have topped out together since 1990.
DOW and Nikkei Tops
We saw this relationship in 2007 where the DOW made a brief new high while the Nikkei completed wave (2) up.
The 2007 charts can be viewed on the Feb 17th 2014 newsletter.
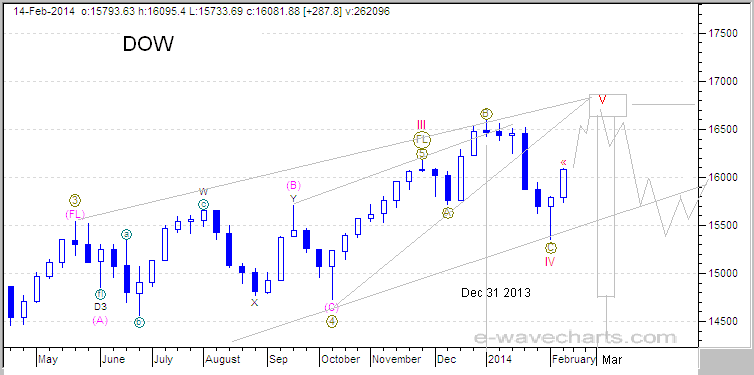
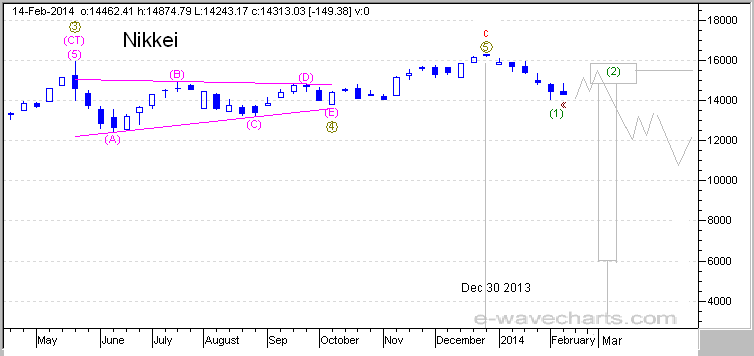
The charts below are from the Feb 17th 2014 newsletter illustrating the expected relationship and topping action.
DOW - Feb 17th Forecast
Nikkei - Feb 17th Forecast
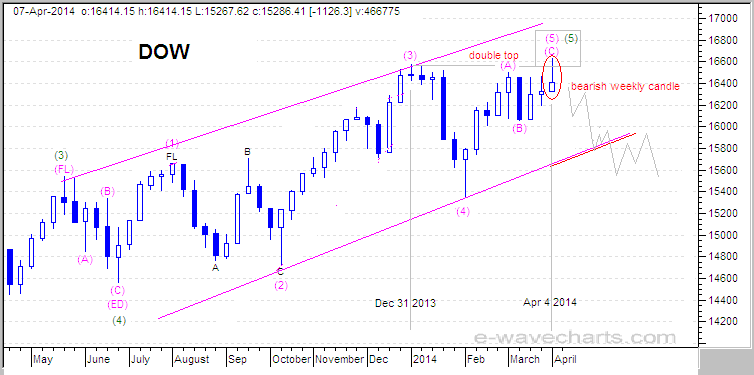
The charts below illustrate the completion of the expected relationship.
DOW - Apr 7th Forecast
Nikkei - Apr 7th Forecast
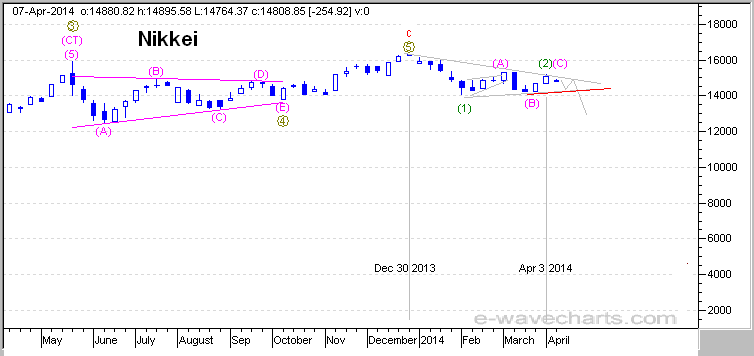
The DOW made a brief new high as a double top, while the Nikkei appears to have complete wave (2) up. This is similar to the brief new high for the DOW in 2007 while the Nikkei completed wave (2) up.
We still need to see further action on the Nikkei to confirm that wave (2) up is complete, since wave (C) fell a little short of the wave (A) high for wave (2) up. Wave (C) was in the target area for completion before the downside today, but we need to see it move lower to negate further upside for wave (C) up. A break below the lower trendlines marked in red will support the count that the rally is complete. A move above the Apr 3rd high would indicate further upside in wave (2)(C).
This newsletter was issued to give you an update that the expected wave (5) top for the DOW is aligned with the Nikkei wave (2) top and they appear to have completed together as expected.
These charts are only a guide so that you can follow the action and monitor the expected outcome. The action could play out exactly as illustrated or it may need minor adjustments as we follow it through.
If you are interested in viewing these updated charts and other detailed charts with targets on a daily basis, please see the registration details below.
Happy Trading!!!
If you are interested in viewing these updated charts and other detailed charts with targets on a daily basis, please see the registration details below.
Elliott Wave Chart Site - IntraDay Market Updates on the DOW, Nasdaq, S&P500, Gold, Silver, HUI and the USD.
To learn more on the status of Gold, Silver, HUI and the USD, please visit the link below for registration details. The commentary and forecasts are updated daily, including intraday commentary and chart updates. Fibonacci pivot dates and cycle analysis are also utilized to forecast reversal dates. The indices covered include the NASDAQ, DOW, S&P 500, SOX, Nikkei, DOW Transports, TSX, BSE, KSE, AORD, HSI, DAX and FTSE. Commodity charts include Copper, XOI, Crude Oil, Nat Gas, Gold, GLD ETF, Silver, SLV ETF, HUI and/or the XAU (Gold and Silver index). Additional Elliott Wave charts cover the US Dollar (USD), EURO FXE ETF, Canadian Dollar (CAD) FXC ETF, 10 Year Treasury Note Yield (TNX), Bank Index (BKX)
With market timing and Elliott Wave Forecasts, we can be on the right side of the market.
Happy Trading!!!
Dan Stinson
Elliott Wave Chart Site e-wavecharts.com
(AEM) and Denison Mines.
Dan Stinson Archive |
© 2005-2022 http://www.MarketOracle.co.uk - The Market Oracle is a FREE Daily Financial Markets Analysis & Forecasting online publication.