


A Crisis vs. the REAL Crisis: Keep Your Eye on the Debt Ball
Stock-Markets / Global Debt Crisis 2014 Apr 22, 2014 - 10:39 AM GMTBy: Casey_Research

 By Laurynas Vegys, Research Analyst
Today I want to talk about crises. Two of the most notable ones that have been in the public eye over the course of the past 6-8 months are obviously the conflicts in Ukraine and Syria. The two are very different, yet both seemed to cause rallies in the gold market.
I say “seemed” because, while there were days when the headlines from either country sure looked to kick gold up a notch, there were also relevant and alarming reports from Argentina and emerging markets like China during many of the same time periods. Nevertheless, looking at the impressive gains during these periods, one has to wonder if it actually takes a calamity for gold to soar.
If so, can the yellow metal still return to and beat its prior highs, absent a major political crisis or a full-blown military conflict? My answer: Who needs a new crisis when we live in an ongoing one every day?
More on this in a moment. Let’s first have a quick look at what happened in Ukraine and Syria as relates to the price of gold. Here’s a quick look at the timeline of some of the major events from the Ukrainian crisis, followed by the same for Syria.
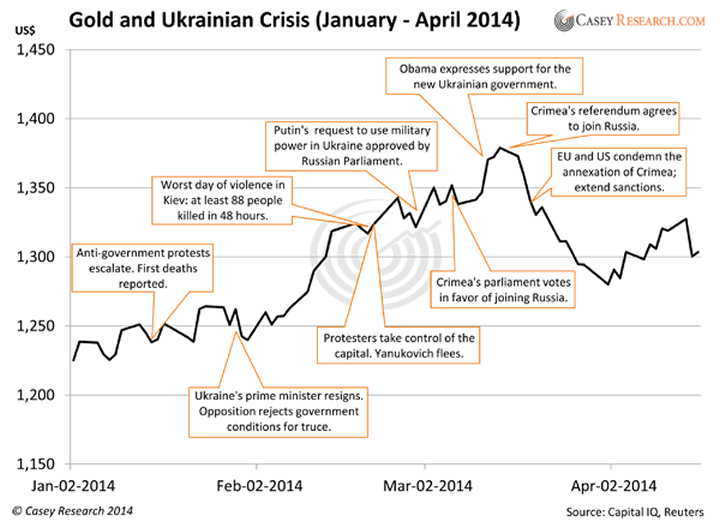
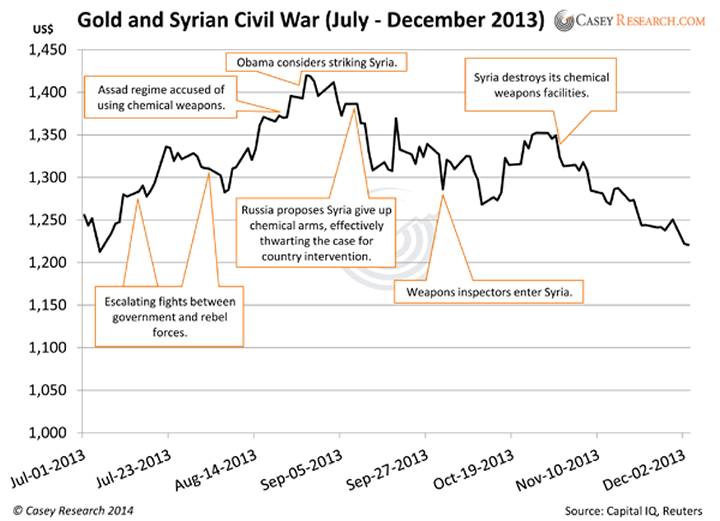
There seems to be a fairly clear pattern in both of these charts. Gold seems to rise in the anticipation of a conflict; once the conflict gets going, or turns out not as bad as feared, however, it sells off.
We see, for example, that as the news broke that chemical weapons were being used in Syria and Obama was threatening to intervene, gold moved up. But when the US did not wade into the bloodshed and Putin proposed his diplomatic solution, gold slid into a protracted sell-off, ending up lower than where it began.
It’s impossible to say with any degree of certainty how much of gold’s recent rise was due to anticipation of the Ukraine/Crimea crisis, but there were certainly days when gold seemed to move sharply in response to news of escalation in the conflict. And again, after it became clear that the US and EU would do little more than condemn Russia’s actions with words, gold retreated. As of this writing, it’s down about $85 from its high a little over a month ago. (We think many investors underestimate the potential impact of tit-for-tat sanctions, but they are not wrong to breathe a sigh of relief that a war of bullets didn’t start between East and West.)
In sum, to the degree that global crisis headlines do impact the price of gold, the effects are short-lived. Unless they lead directly to consequences of long-term significance, these fluctuations may capture the attention of day traders, but are little more than distractions for serious gold investors betting on the fundamentals.
You have to keep your eye on the ball.
The REAL Crisis Brewing
Major financial, economic, or political trends—the kind we like to base our speculations upon—don’t normally appear as full-fledged disasters overnight. In fact, quite the opposite; they tend to lurk, linger, and brew in stealth mode until a boiling point is finally reached, and then they erupt into full-blown crises (to the surprise and detriment of the unprepared).
Fortunately, the signs are always there… for those with the courage and independence of mind to take heed.
So what are the signs telling us today—what’s the real ball we need to keep our eyes upon, if not the distracting swarm of potential black swans?
The big-league trend destined for some sort of major cataclysmic endgame that will impact everyone stems from government fiscal policy: profligate spending, leading to debt crisis, leading to currency crisis, leading to a currency regime change. And not in Timbuktu—we’re talking about the coming fall of the US dollar.
The first parts of this progression are already in place. Consider this long-term chart of US debt.
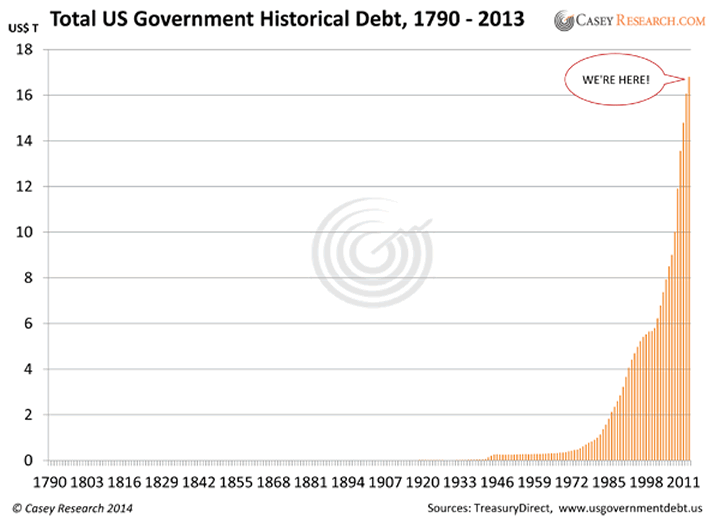
Notice that government debt was practically nonexistent halfway through the 20th century, but has seen a dramatic increase with the expansion of federal government spending.
Consider this astounding fact: The government has accumulated more debt during the Obama administration than it did from the time George Washington took office to Bill Clinton’s election in 1992. Total US government debt at the end of 2013 exceeded $16 trillion.
Let’s put that in perspective, since today’s dollars don’t buy what a nickel did a hundred years ago.
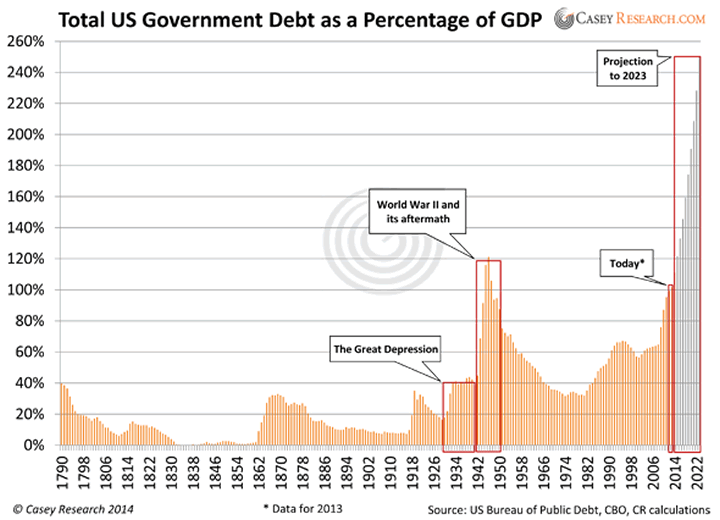
Except for the period of World War II and its immediate aftermath, never before has the US government been this deep in debt. Having recently surpassed the threshold of 100% debt to GDP, America has crossed into uncharted territory, getting in line with the likes of…
- Japan, “leading” the world with a 242% debt-to-GDP ratio
- Greece: 174%
- Italy: 133%
- Portugal: 125%
- Ireland: 117%
The projection in the chart above is based on the 9.4% average annual rate of debt-to-GDP growth since the US embarked on its current course in response to the crash of 2008. If the rate persists, the US will be deeper in debt relative to its GDP than Ireland next year, deeper than Portugal in 2016, Italy in 2017, Greece in 2019, and even Japan in 2023 (and the US does not have the advantage of decades of trade surpluses Japan had).
Granted, the politicians and bureaucrats say they will slow this runaway train, but we’re not talking about Fed tapering here. Congress will have to embrace the pain of living within its means. We’ll believe that when we see it.
But let’s take a more conservative, 10-year average growth rate (an arbitrary standard many analysts use): 5.3%. At this rate, the US will still be deeper in debt than Ireland and Portugal in 2017, Italy in 2019, Greece in 2024, and Japan in 2030.
Either way, this is still THE crisis of our times; all of the countries mentioned above are undergoing excruciating economic and social pain. It’s no stretch to imagine the kind of social and political turmoil that has resulted from the European debt crisis coming to Main Street USA, as American debt goes off the charts.
It’s also important to understand that the debt charted above excludes state and local debt, as well as the unfunded liabilities of social entitlement programs like Social Security and Medicare.
This ever-growing mountain—volcano—of government debt is a long-term, systemic, and extremely-difficult-to-alter trend. Unlike the crises in Ukraine and Syria (at least, so far), it’s here to stay for the foreseeable future. While some investors have grown accustomed to this government-created phenomenon and no longer regard it as dangerous as outright military conflict, make no mistake—in the mid to long term, it’s just as dangerous to your wealth and standard of living.
Still think it can’t happen here? To fully understand how stealthily a crisis can sneak up on you, watch Casey Research’s eye-opening documentary, Meltdown America.
Disclaimer: The above is a matter of opinion provided for general information purposes only and is not intended as investment advice. Information and analysis above are derived from sources and utilising methods believed to be reliable, but we cannot accept responsibility for any losses you may incur as a result of this analysis. Individuals should consult with their personal financial advisors.
Casey Research Archive |
© 2005-2022 http://www.MarketOracle.co.uk - The Market Oracle is a FREE Daily Financial Markets Analysis & Forecasting online publication.