


Gold Breaks Out As Cold War 2.0 Intensifies - Technicals, Fundamentals Positive
Commodities / Gold and Silver 2014 Aug 08, 2014 - 09:31 PM GMTBy: GoldCore

 Today’s AM fix was USD 1,317.50, EUR 984.02 and GBP 784.23 per ounce. Yesterday’s AM fix was USD 1,302.00, EUR 973.53 and GBP 772.98 per ounce.
Gold climbed $5.20 or 1.42% yesterday to $1,311.60/oz and silver fell $0.08 or 1.16% to $19.96/oz.
Gold is up nearly 2% this week on safe haven buying, its best weekly performance since mid-June. Gold hit three week highs overnight at $1,322.60/oz, having started to push higher in U.S. trading hours yesterday due to tensions with Russia and the renewed bombing of Iraq.
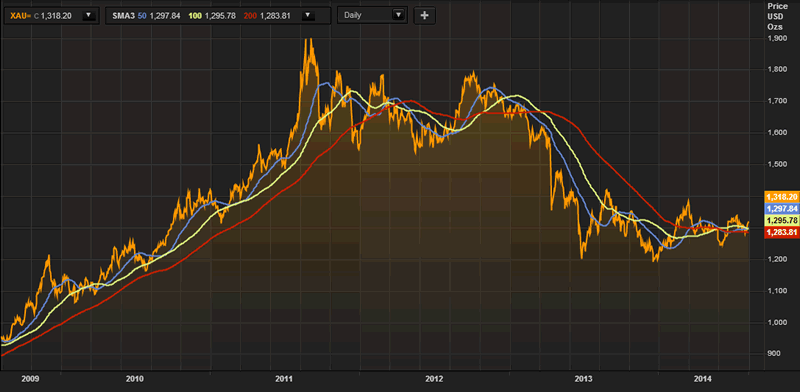
Gold in US Dollars - 2 Years (Thomson Reuters)
Gold is flat in London this morning after gold bullion in Singapore consolidated on yesterday’s gains and crept marginally higher. President Obama’s authorization of air strikes in Iraq saw stocks fall globally and led to demand for haven assets - the Swiss franc strengthened as did oil and gold.
Traders were surprised that prices were capped from further gains and there was not more of a safe haven bid and more technical related buying after gold broke above the 50, 100 and 200 day moving averages.
Silver is outperforming again and is up 0.9% to $20.13, while the platinum group metals are also higher with platinum up 0.4% to $1,489 an ounce.
Palladium added 0.7% to $867 an ounce. It is consolidating near its 13-year nominal high of $889.75 reached on July 17. Palladium has risen 19% this year due to increased industrial and investment demand and due to concerns about supply from South Africa and especially Russia.
Palladium has risen 19% this year due to increased industrial and investment demand and due to concerns about supply from South Africa and especially Russia.
Gold remains in its summer doldrums despite the western world sleepwalking into another major conflict with Russia and potentially another World War.
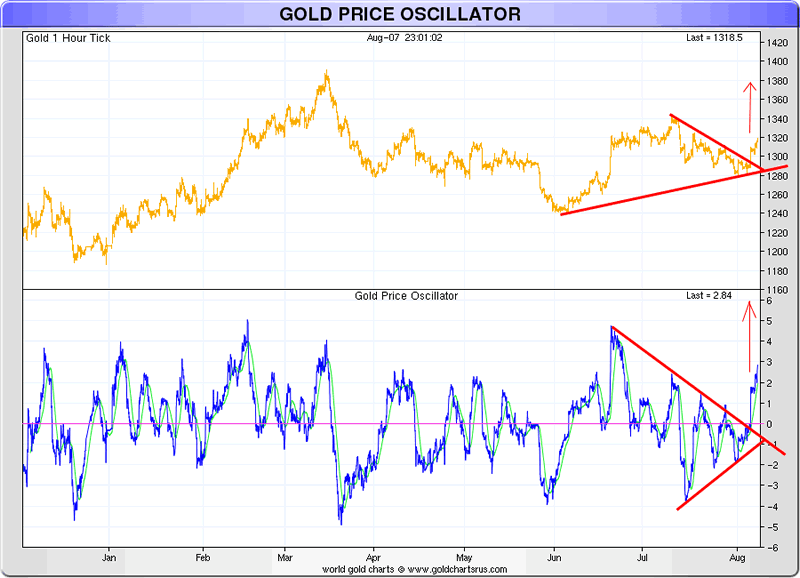
Gold’s Bullish Technicals As Breaks Out Of Falling Wedge
Gold is nearly 2% higher this week and its technical position has further improved.
On Wednesday, gold broke out of bullish descending wedge chart pattern that has formed in recent months. The falling wedge is a generally bullish pattern signaling that a market will break upwards through the wedge and move into an uptrend.
Another buy signal for gold came when gold rose above the 20 EMA and 50 EMA (exponential moving averages). Also positive is the fact that the price momentum oscillator (PMO) has turned up (see charts), indicating that a positive momentum shift has occurred.
As Sharelynx noted overnight:
“Stepping back a little we see the larger picture. A strong break here above the red line will indicate that the bear is over & the new bull alive & well. With the price oscillator a move above 10 (see below) will see the gold price above $1,400 & be a major buy signal.”
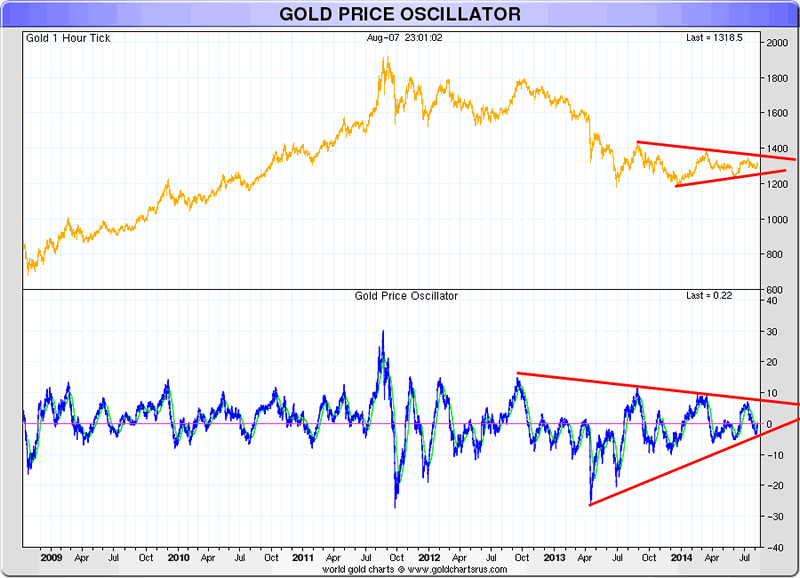
The weekly PMO is also climbing meaning that there is positive momentum in the intermediate to long term. Therefore, there is a good chance that we are looking at a new rally in gold and the next leg of the bull market. Especially given the huge uncertainty in markets today - which looks set to continue.
This uncertainty has led to significant falls in many stock markets in recent days.
Gold is again showing its inversion correlation to stock markets and rising when they fall. This can clearly be seen in the Dow Gold Ratio - an important indicator that we frequently look at.
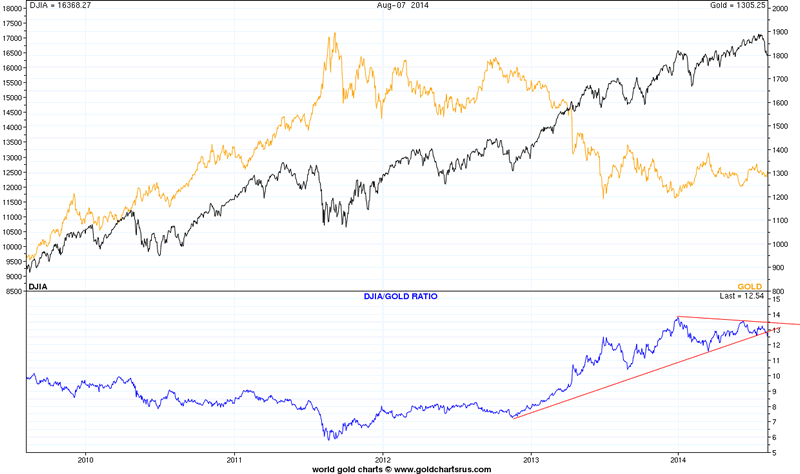
We can clearly see a trend reversal here as the Dow Gold Ratio has fallen back below 12.5 (DJIA 16,368 / $1,319 per oz) and has fallen out of the recent wedge formation suggesting a movement lower.
U.S. stock markets and many stock markets globally are overvalued on a variety of benchmarks after huge gains in recent months. Gold on the other hand is undervalued after a sharp correction and period of consolidation in recent years.
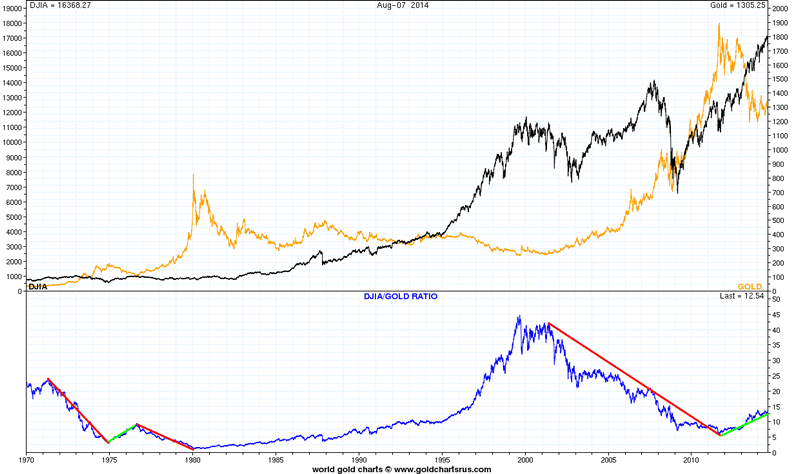
We continue to favour the Dow Gold Ratio chart as a good indicator as to when the gold bull market might end. It is likely to reach the levels seen in 1980 (see chart), close to 1:1 or the Dow at between 3,000 and 10,000 and gold at between $3,000/oz and $10,000/oz.
This will be an indication that the gold bull market will be in its final innings. Provided of course we do not return to some form of gold standard in a coming global currency reset in which gold is revalued to a new much higher fixed price.
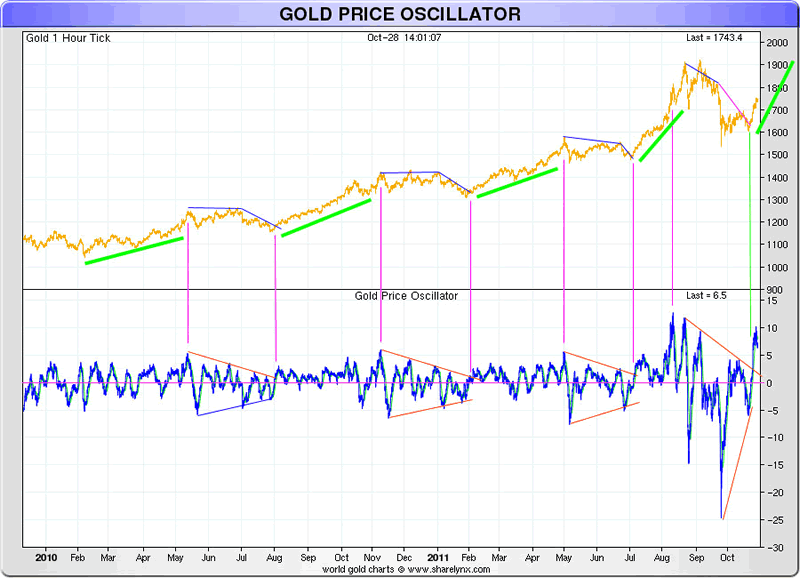
It is also important to note that there was a 2 year period in the 1970’s when the Dow Gold ratio bounced higher after years of falling, prior to the secular, long term trend reasserting itself (see chart).
Long Term Fundamentals - Macroeconomic, Geopolitical, Systemic and Monetary (MGSM) Risk
Global Macro and Geopolitical Picture
As ever it is important to focus on the medium and long term drivers of the gold market which include the abated but far from concluded global debt crisis, systemic risk, geopolitical risk and of course monetary or currency risk.
The long term case for precious metals is based on the four primary drivers - the ‘MGSM’ drivers that it is important to focus on.
Macroeconomic Risk Macroeconomic risk is high as there is a serious risk of recessions in major industrial nations and in emerging markets, especially Russia, with mixed data emanating from the debt laden Eurozone, U.K., Japan, China and U.S.
Economic sanctions and the Russian banning of food imports from the United States, the European Union, Australia, Canada and Norway for one year will likely impact on already fragile Eurozone economies.
Africa and west Africa in particular is already feeling the impact of the ebola virus - investment and cross-border commerce has slowed already as transport and freight is effected and international companies impose restrictions on business with the countries where Ebola is present.
Eurozone Debt Crisis The Eurozone debt crisis is far from over and will rear its ugly head again. Events in Portugal in recent days clearly show that. Politicians and bankers have managed to delay the inevitable day of reckoning by piling even more debt onto the backs of already struggling taxpayers thereby compounding the problem and making it much worse in the long term.
This week came news that Italy has fallen back into recession and this is just one indication that the Eurozone debt crisis will rear its ugly head again. Greece, Spain, Portugal, Italy, Ireland and France remain vulnerable. Bail-ins pose a real risk to savers.
Japan, U.K., U.S. Debt Crisis In Japan, the national debt has topped the ¥1 quadrillion mark a year ago - last August. A policy of money printing pursued for a decade is failing abysmally. Now, politicians look set to pursue currency debasement in an even more aggressive manner – with attendant consequences.
The U.K. is one of the most indebted countries in the industrialised world - the national debt continues to rise rapidly and is now at more than 1.28 trillion pounds and total (private and public) debt to GDP in the U.K. remains over 500%.
The U.S. government is technically insolvent. At the start of the 'credit crisis' seven years ago, U.S. federal debt was just $8.9 trillion. Today, U.S. federal debt stands at $17.65 trillion - nearly 100% higher and increasing rapidly. This does not include the $70 trillion to $100 trillion in unfunded liabilities for social security, medicare and medicaid.
Systemic Risk Systemic risk remains high as few of the problems in the banking and financial system have been addressed. The six largest banks in the world are larger now than they were prior to Lehman and there is a real risk of another 'Lehman Brothers' moment and seizing up of the global financial system.
The massive risk from the unregulated “shadow banking system” continues to be underappreciated. Reform and regulation has been slow and ineffectual.
Argentina’s default or another large sovereign default or bank default could have drastic consequences in the credit default swap (CDS) market and lead to contagion.
Geopolitical Risk Geopolitical risk remains elevated - particularly in the Middle East. This is seen in the serious developments in Israel and increasing tensions between Israel and its neighbours in the region.
ISIS are posing a threat to oil rich governments and despots throughout the region - including Saudi Arabia. There remain tensions with Iran who did an important oil deal with Russia during the week.
There is the real risk of conflict and consequent effect on oil prices and then on the global economy.
We were one of the few investment houses to clearly warn in recent years about the simmering tensions between the U.S. and its western allies and Russia. Similar tensions are simmering with China and may become manifest if China allies themselves with Russia.
Monetary Risk Monetary risk or currency risk remains high as the policy response of the Federal Reserve, the ECB, the Bank of England and the majority of central banks to the risks mentioned above continues to be to be ultra loose monetary policies, zero interest rate policies (ZIRP), negative interest rate policies (NIRP), deposition confiscation or “bail-ins”, the printing and electronic creation of a tsunami of money and the debasement of currencies.
Should the macroeconomic, systemic and geopolitical risks increase even further in the coming months, as seems likely, than the central banks response will likely again be more cheap money policies and further currency debasement which risks currency wars deepening.
Conclusion
The technicals of gold are increasingly aligned with the bullish fundamentals and the still positive fundamental backdrop of significant macroeconomic, systemic, geo-political and monetary risk.
Gold is good value at these levels. The global average cost of production is between $1,200/oz and $1,250/oz. Therefore, there is very little downside risk, while there is significant upside potential.
If the very positive demand and supply fundamentals assert themselves then we should see gold enter a new bull market. Buyers are advised to dollar, pound and euro cost average into position to protect from further corrections and pullbacks and to always own allocated and segregated physical bullion.
It remains prudent to hope for the best but be prepared for less benign scenarios.
This update can be found on the GoldCore blog here.
Yours sincerely,
Mark O'Byrne
Exective Director
IRL |
UK |
IRL +353 (0)1 632 5010 |
WINNERS MoneyMate and Investor Magazine Financial Analysts 2006
Disclaimer: The information in this document has been obtained from sources, which we believe to be reliable. We cannot guarantee its accuracy or completeness. It does not constitute a solicitation for the purchase or sale of any investment. Any person acting on the information contained in this document does so at their own risk. Recommendations in this document may not be suitable for all investors. Individual circumstances should be considered before a decision to invest is taken. Investors should note the following: Past experience is not necessarily a guide to future performance. The value of investments may fall or rise against investors' interests. Income levels from investments may fluctuate. Changes in exchange rates may have an adverse effect on the value of, or income from, investments denominated in foreign currencies. GoldCore Limited, trading as GoldCore is a Multi-Agency Intermediary regulated by the Irish Financial Regulator.
GoldCore is committed to complying with the requirements of the Data Protection Act. This means that in the provision of our services, appropriate personal information is processed and kept securely. It also means that we will never sell your details to a third party. The information you provide will remain confidential and may be used for the provision of related services. Such information may be disclosed in confidence to agents or service providers, regulatory bodies and group companies. You have the right to ask for a copy of certain information held by us in our records in return for payment of a small fee. You also have the right to require us to correct any inaccuracies in your information. The details you are being asked to supply may be used to provide you with information about other products and services either from GoldCore or other group companies or to provide services which any member of the group has arranged for you with a third party. If you do not wish to receive such contact, please write to the Marketing Manager GoldCore, 63 Fitzwilliam Square, Dublin 2 marking the envelope 'data protection'
GoldCore Archive |
© 2005-2022 http://www.MarketOracle.co.uk - The Market Oracle is a FREE Daily Financial Markets Analysis & Forecasting online publication.