China Stock Market Crash Terrorises Global Stock Markets
Stock-Markets / Stock Markets 2016 Jan 08, 2016 - 02:23 AM GMTBy: Nadeem_Walayat
 The Chinese stock market already weak going into the end of 2015 started 2016 off with a BANG, literally crashing on a near daily basis by hitting the 7% circuit breaker daily limit moves prompting a closure of the market, only to resume to the free fall the following morning as investors panic sold on the open attempting to sell before the circuit breaker kicks in, resulting in a market that has locked out most retail participants as they watch their stock portfolio valuations evaporate. This daily 7% limit down crashes prompted the Chinese authorities Thursday to suspend the circuit breaker which should have the effect of alleviating the panic selling going forward.
However, damage has been done as China's financial terror has spread and hit the global stock markets hard after already ending 2015 on a weak note, and now bringing daily bouts of selling right across the board, which whilst not on the scale of China's panic, nevertheless each days selling has done at least some technical damage to many indices.
The following graph further illustrates how the Chinese stock market SSEC index has dragged major global stock market indices lower since just before the start of 2016 (INDU, FTSE, DAX) plotted against the China SSEC index.
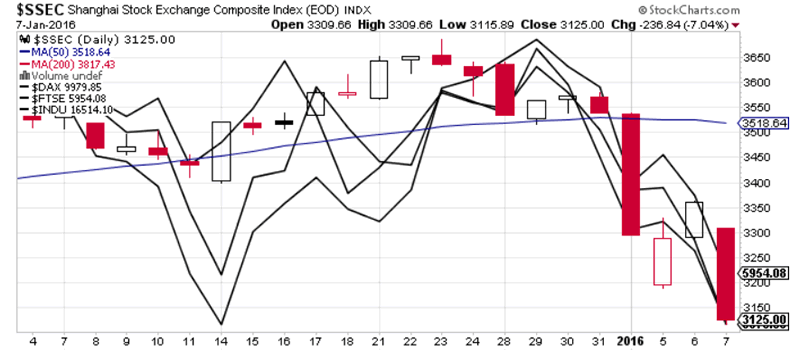
The impact of China on global stock markets literally could not have been any worse as major indices have had their worst opening start to a new year for decades! Of course for China, the worlds second largest economy, it's a case of fundamentals of a weakening economy that despite communist party propaganda expectations for 6.5% GDP growth for 2016 which in my opinion will be lucky to beat 4%. What's worse is the growing risk that China's debt bubble poses that has seen total debt rise from 160% of GDP 10 years ago to currently stand at 250% of GDP, that in a worse case scenario could trigger a 2008 style Chinese financial crisis which the likes of George Soros have been declaring as imminent that would soon consume China's $3.3 trillion of reserves which is already being consumed at the rate of $100 billion per month, thus triggering waves of selling of foreign investments held by China's sovereign wealth funds so as to support the domestic economy that would ripple out across western markets which would likely trigger central banks to inject fresh QE into local bond and stock markets.
China Stock Market
My long forecast for the Chinese stock market was for the SSEC index to spend the remainder of 2015 stuck in a trading range of between approx 3,500 to 3,000 from the then level of 3,400:
13 Jul 2015 - China Crash, Greece Collapse, Harbingers of Stock Market Apocalypse Forecast 2015?
China Stock Market Forecast Conclusion
Pulling all of the threads together implies that the current rally is corrective, following which the SSEC bear market looks set to resume with a vengeance with the SSEC targeting 2,500! Which is quite some distance from its last close of 3877.
As for what happens after SSEC 2,500 is less clear, I am leaning towards probability favouring a dip to 2,500 being a panic spike that soon reverses higher and resolves to base building between 3,000 and 3,500 for the remainder of 2015. However, if the spike low rally fails then that could yet trigger FURTHER panic that plunges the SSEC into a deeper trading range of 2,000 to 2,500 for several years.
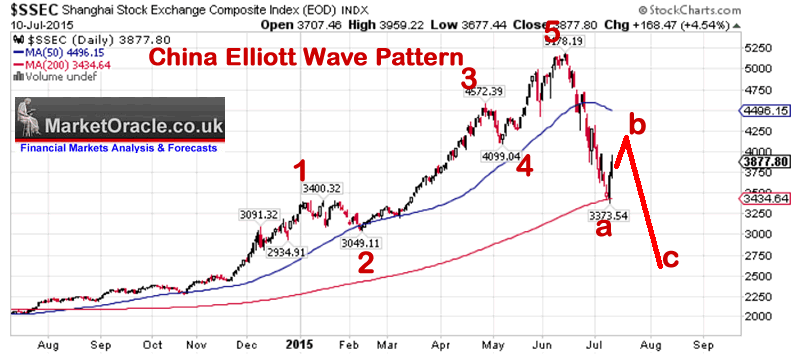
The updated SSEC chart reveals that China has in large part followed the script which despite the recent price plunges, the SSEC has so far NOT significantly extended outside of its trading range, that is likely to persist well into 2016,which therefore implies further downside is limited and with heavy support in the 2,800 to 3,000 region against the most recent close of 3,125. So at this point in time the all prevailing doom and gloom in the mainstream media is not really justified, not until the 2800 support breaks which as my earlier in-depth analysis suggested would target a drop to 2,500.
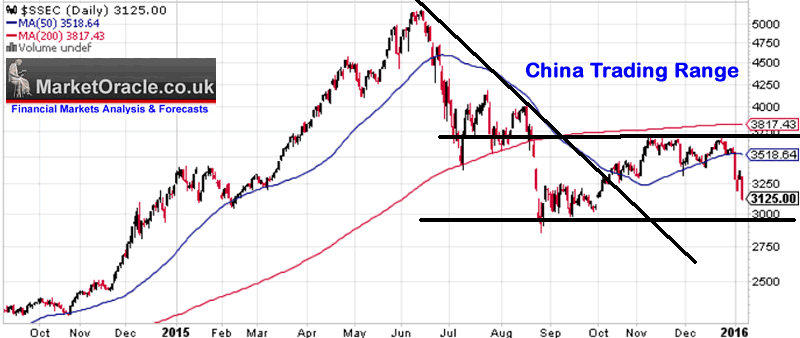
So the bottom line is that whilst daily 7% limit down drops are not pretty, and foster much attention from the usually clueless mainstream media. However, technically the SSEC remains in a trading range of approx 3,800 to 3,000, with the last close of 3125 near the bottom of the range, so as of writing SSEC appears to be very near making a bottom, which is a far cry from the widespread doom, gloom and panic out there.
Dow Brief Interim Analysis
As for the Dow and ahead of my forthcoming in-depth analysis and a detailed Stock Market trend forecast for 2016, my quick technical take suggests -
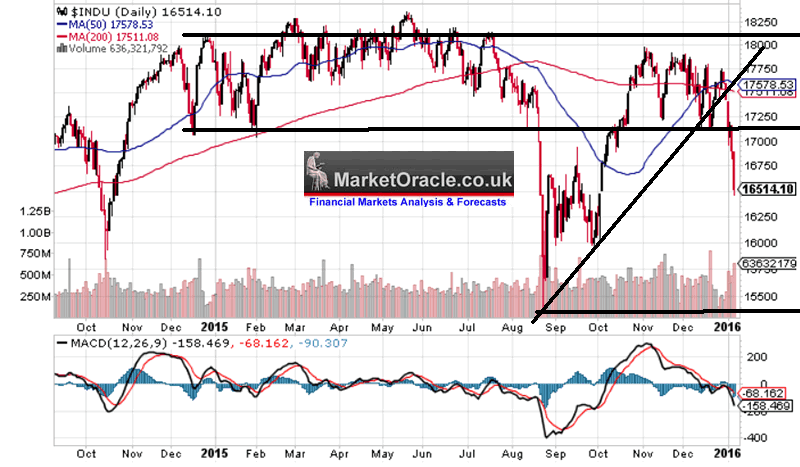
The Dow's last close of 16,514 has taken the Dow significantly below support of 17,000, never mind attempts to break above 18,000. So the Dow starts 2016 technically weakened, which means for the bull market to attempt to resume a trend towards a series of new all time highs then will need to recover back into the 18,000 to 17,000 trading range. Whilst to the downside the next major support kicks in around Dow 16k. However, rather than continuing its plunge to Dow 16k, probability instead favours the Dow at least attempting to regain the 18k to 17k trading range which thus should be the stock markets direction over the coming week or so.
The following graph further illustrates that the doom merchants are once more running ahead of themselves, and that most are conveniently ignoring the fact that they have been wrong for 7 years, during which time had they followed their so called market calls with actual trading positions then they would have been wiped out several times each year!
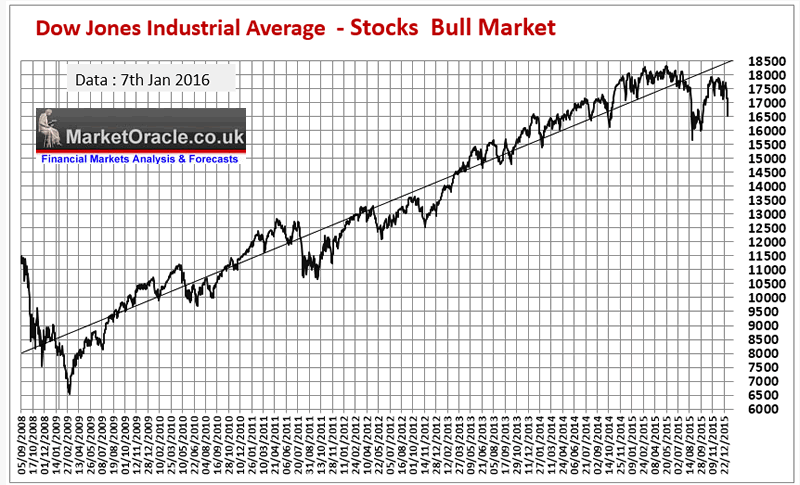
The bottom line is that despite recent price falls, the Dow is only 10% off its all time high of 18,351 and well within it's 20% corrective trading range of between 18,350 and 15,500 which could turn out to be THE pattern for 2016. This is just my interim analysis ahead of in-depth analysis that will conclude in detailed trend forecasts across several major markets so ensure you are subscribed to my always free newsletter that includes the following planned newsletters -
- Interest Rates 2016
- US Dollar Trend Forecast
- US House Prices Forecast 2016 and Beyond
- Stock Market Trend Forecast 2016
- Crude Oil Trend 2016
- Gold and Silver Price Forecast 2016
 Also subscribe to our Youtube channel for notification of video releases and for our new series on the 'The Illusion of Democracy and Freedom', that seeks to answer questions such as 'Did God Create the Universe?' and how to 'Attain Freedom' as well as a stream of mega long term 'Future Trend Forecasts'.
By Nadeem Walayat
Copyright © 2005-2016 Marketoracle.co.uk (Market Oracle Ltd). All rights reserved.
Nadeem Walayat has over 25 years experience of trading derivatives, portfolio management and analysing the financial markets, including one of few who both anticipated and Beat the 1987 Crash. Nadeem's forward looking analysis focuses on UK inflation, economy, interest rates and housing market. He is the author of five ebook's in the The Inflation Mega-Trend and Stocks Stealth Bull Market series that can be downloaded for Free.
 Nadeem is the Editor of The Market Oracle, a FREE Daily Financial Markets Analysis & Forecasting online publication that presents in-depth analysis from over 1000 experienced analysts on a range of views of the probable direction of the financial markets, thus enabling our readers to arrive at an informed opinion on future market direction. http://www.marketoracle.co.uk
Disclaimer: The above is a matter of opinion provided for general information purposes only and is not intended as investment advice. Information and analysis above are derived from sources and utilising methods believed to be reliable, but we cannot accept responsibility for any trading losses you may incur as a result of this analysis. Individuals should consult with their personal financial advisors before engaging in any trading activities.
Nadeem Walayat Archive |
© 2005-2022 http://www.MarketOracle.co.uk - The Market Oracle is a FREE Daily Financial Markets Analysis & Forecasting online publication.


