


FOMC Bring on the Clowns, Dollar, Gold and Bonds
Stock-Markets / Financial Markets 2016 Mar 17, 2016 - 12:14 PM GMTBy: Dan_Norcini

 Honestly, more and more that seems to be the best phrase to describe when waiting for these FOMC statements to be revealed.
If we are not seeing a case of deliberate attempts to break the back of their own currencies among these Central Bankers, then "Scotty, beam me up!"
With the Fed Fund futures showing sharp increases AHEAD of the FOMC statement of rate hike probabilities, today's ultra dovish statement had everyone positioned on the wrong side of the currency markets yet once again. The result was yet another unleashed chaos courtesy of our Central Bankers.
The Dollar collapse, combined with the production cut numbers in oil from the EIA this morning, lit a fire under the energy markets. The fire also spread to the mining shares and into gold.
Here is a two hour chart of gold. Look at the surge in volume again. After being range bound between $1237-$1225 ahead of the report, the metal blew through the top of the range in short order and basically went vertical with barely a pause until it hit $1260 where it took a bit of a breather.
2-Hour Gold Chart
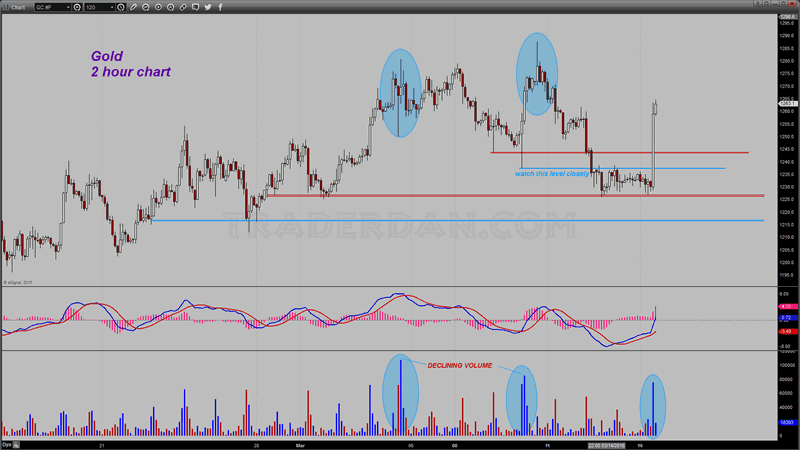
This thing now looks like it is going to try to test $1270 once more. It has garnered willing sellers above $1275 and has not been able to spend much time above that level before moving lower but that was before we knew how dovish the FOMC was. Whether or not that is a game changer is unclear but the Fed certainly did take one of the factors that would have been considered a negative away from gold with their statement today.
Two other factors remaining are currency debasement and risk.
Look at the Dollar chart.
US Dollar Index Daily Chart
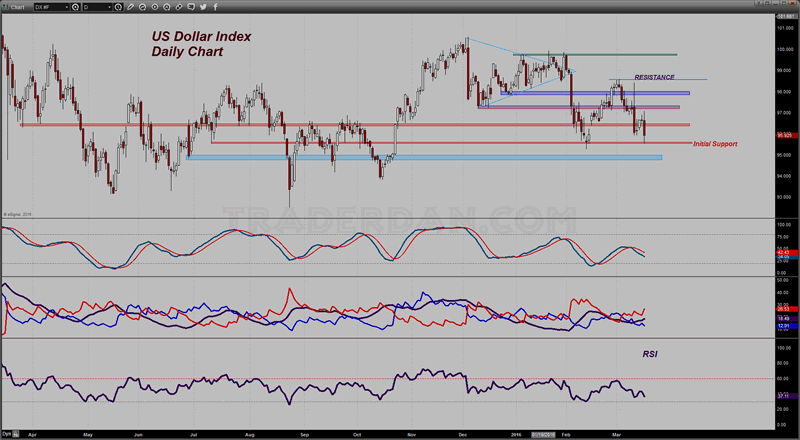
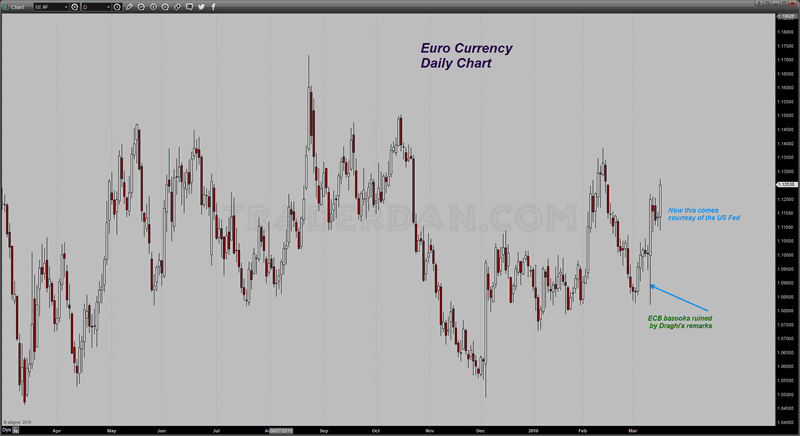
Apparently 98.50 basis the USDX is too high for this Fed so out comes a dovish statement. The question is how do Draghi and company, not to mention Kuroda and company answer this??? I honestly don't know. What I do know however is that the ECB in particular must be fuming this afternoon. They just unleashed their big bazooka last week and for what? The Euro is climbing back up again.
Euro Daily Chart
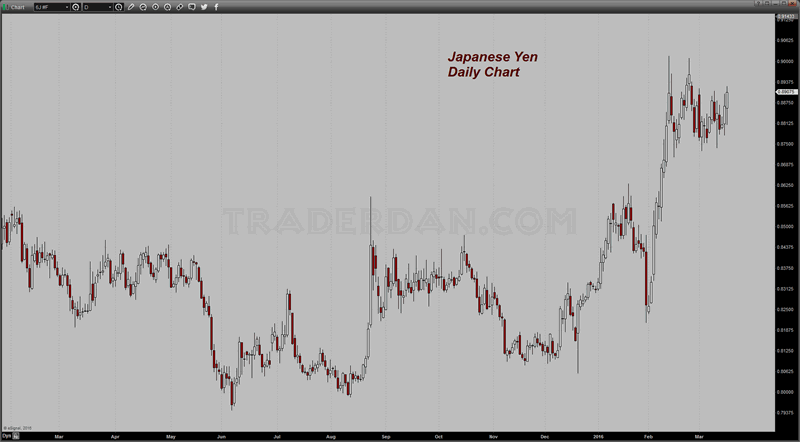
Japanese Yen Daily Chart
The sharp selloff in the Dollar took gold mining stocks sharply higher with the HUI gaining a huge 6.6% today.
HUI Daily Chart
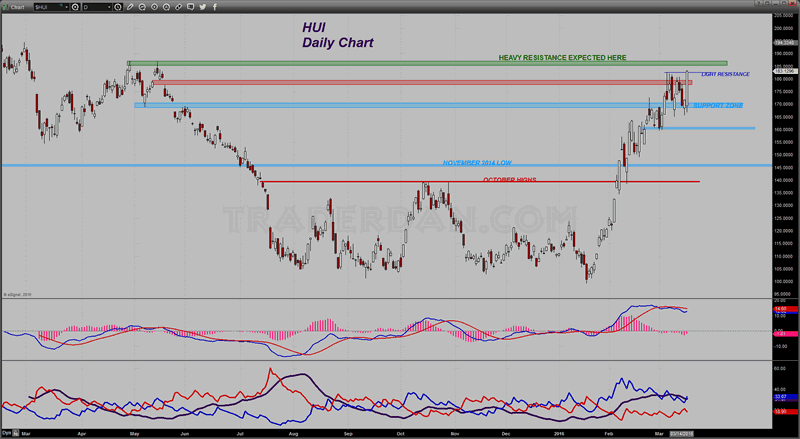
It closed through an area marked "light resistance" on the chart shown posting its highest CLOSE since May of last year. Pretty impressive stuff! The question is now, that it has managed to put itself in a realistic position to challenge heavy resistance at the April/May 2015 double top, can it finally take that out?
If it can, we should see the index at the March 2015 high near 195.
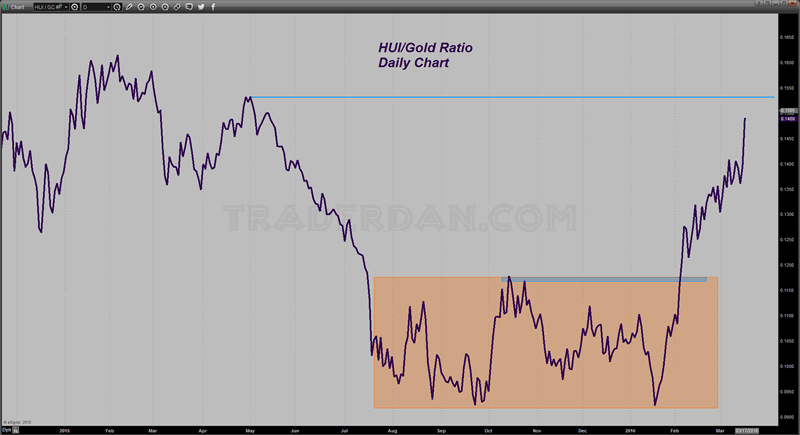
The falling HUI/Gold ratio spun on a dime and reversed higher today providing some good news for gold bulls. Notice how the ratio is moving towards that May 2015 peak as well.
HUI/Gold Ratio Daily Chart
There was another addition in the reported holdings of GLD this afternoon as well, further fodder for gold bulls.
This time it was 3 tons. Between yesterday's addition of 2 tons and today's 3, it has helped offset that very large 8.6 ton drop, the largest of the year, that took place on Monday. Amazing what a few words in an FOMC statement can do to flip sentiment!
Speaking of changing sentiment - there was a huge spike in the yield curve today after this FOMC statement. The spread between the Ten Year and the Two Year STEEPENED an astonishing 8 basis points in a single day! The bond markets were completely caught off guard by this dovish statement.
Two Year - 10-Year Spread
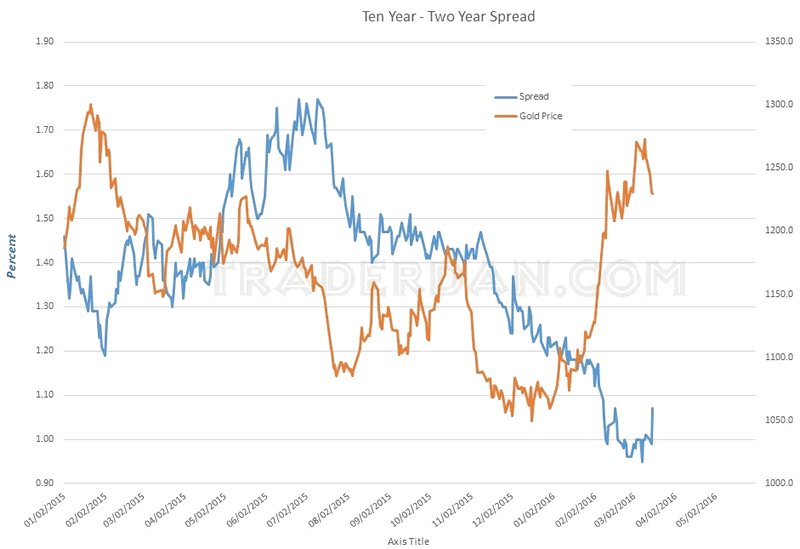
Now we need to see whether this is a one day wonder and the spread begins to flatten some more or if the bond players think that the dovish Fed policy will start stimulating growth and ushering in some inflation concerns.
It makes sense for the curve to steepen on the heels of a sharp selloff in the Dollar since commodities overall moved higher today ( see copper, silver, platinum, gold, energy, cattle, etc.). Everyone keeps wondering, each and every time we get something like this, whether or not, this is going to be the beginning of the long awaited drive into inflation displacing deflation concerns or whether it is yet another head fake caused by massive short covering across the commodity sector.
If it is inflationary, the long bond seemed not to know it as it barely budged today.
US Long Bond Daily Chart
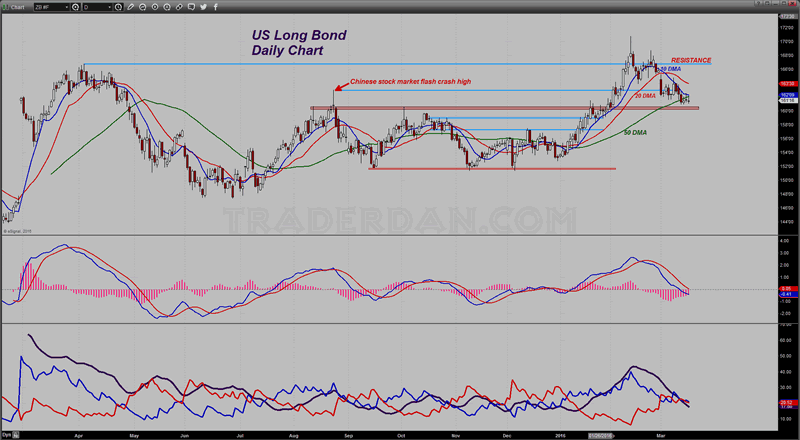
It's chart pattern, while having deteriorated as it is below the 50 day moving average, still remains unclear. A fall through 160 would suggest that bond traders are beginning to move further away from deflation fears but as you can see by the falling lines on the ADX/DMI indicator, convictions are not very deep-seated either way right now.
We are back to waiting for the outcome of this grand experiment in monetary policy between low to negative interest rates and the forces of deflation and no one knows for sure what to think. Everything is SHORT TERM ORIENTED as far as these markets go with price moving in the path of least resistance on any given day. Until we see some sort of solid evidence that the Central Banks are winning, I expect this uncertainty to remain. I for one would dearly love to see a solid trend.
Dan NorciniDan Norcini is a professional off-the-floor commodities trader bringing more than 25 years experience in the markets to provide a trader's insight and commentary on the day's price action. His editorial contributions and supporting technical analysis charts cover a broad range of tradable entities including the precious metals and foreign exchange markets as well as the broader commodity world including the grain and livestock markets. He is a frequent contributor to both Reuters and Dow Jones as a market analyst for the livestock sector and can be on occasion be found as a source in the Wall Street Journal's commodities section. Trader Dan has also been a regular contributor in the past at Jim Sinclair's JS Mineset and King News World as well as may other Precious Metals oriented websites.
Copyright © 2016 Dan Norcini - All Rights Reserved
All ideas, opinions, and/or forecasts, expressed or implied herein, are for informational purposes only and should not be construed as a recommendation to invest, trade, and/or speculate in the markets. Any investments, trades, and/or speculations made in light of the ideas, opinions, and/or forecasts, expressed or implied herein, are committed at your own risk, financial or otherwise. The information on this site has been prepared without regard to any particular investor’s investment objectives, financial situation, and needs. Accordingly, investors should not act on any information on this site without obtaining specific advice from their financial advisor. Past performance is no guarantee of future results.
Dan Norcini Archive |
© 2005-2022 http://www.MarketOracle.co.uk - The Market Oracle is a FREE Daily Financial Markets Analysis & Forecasting online publication.