


Stock Market Forecasting Made Simple
InvestorEducation / Learn to Trade Jul 18, 2008 - 11:01 AM GMTBy: Mike_Stathis

 By now I hope you're beginning to see how things play out in a bubble meltdown. If you didn't learn how the drama, deceit, panic and denial pummeled the market piece by piece during the dotcom bubble collapse, you have a chance to learn first hand from the current implosion in the real estate driven credit bubble. You would be wise to learn the typical course of these asset blow outs since it appears as if the Fed intends to keep creating bubbles and letting them implode as its only way to create reasonable, but fictitious GDP growth.
Generally speaking, throughout the decline of a bubble, there is a new theme every month or so. And in-between these periods, the “no news is good news” sentiment is usually cause for a market rally in the early stages, as denial remains a strong force. At a later stage when “no news” isn't enough to lift the market, pundits and CEOs come out and claim that the worst is over. Let's look back at the past 18 months and see how things played out.
A Look at the Recent Past
In late February of 2007 we saw the first signs of problems with mortgage companies that were buried deep in sub-primes.
(1) After a drop of around 500 points, the market rallied to new highs by late April.
(2) Next, the move from early March to mid-July was huge, the Dow having moved from 12,000 to 14,000.
(3) Then the avalanche began and the market dropped by 1200 points over about 4 weeks.
(4) But one day in particular it fell to around 11,500 intraday and closed up significantly.
(5) That intraday low was a key level that I knew would be retested down the road. In fact, I was certain it would fall through it based on what I knew about the troubles in the real estate market and banks.
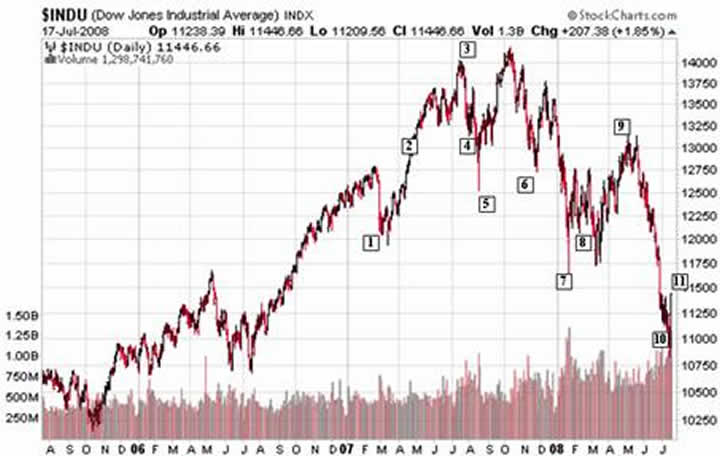
By early October 2007, the market made a new all-time high, of around 14,200. Many of the banks rallied, some to year highs. Incidentally, this was when I made a call to clients to short the banks. This period would mark the beginning of what would later be the zig-zag downward pattern typically seen during bear market corrections. By November, Countrywide was facing insolvency. (6) And by mid-January 2008, the market made a very large and rapid sell off, sending it down to 12,000. Much of this was due to the news of problems faced by the bond insurers.
(7) Although they had experienced problems in late 2007, Countrywide overshadowed everything else at the time since most felt it was the strongest of all mortgage companies. By early March of 2008, chart analysis confirmed a trend reversal.
(8) But Wall Street and the media managed to prop the market back up to 13,100 by early May.
(9) Of course, if you had looked at the chart, you would have easily identified this as a bear trap. I released an article “Stay Clear of Traditional US Asset Classes” in early May explaining what had happened, where we were and where we were headed. I concluded that the market was overextended both in the short and intermediate-term and advised investors to start selling with an emphasis on taking short positions in the financials. Since then, the market has fallen to 10,731.
(10)I was confident we would retest the intraday low made in January 2008 of 11,500, followed by a break down to hover around 11,200. Since that level, the Dow has broken down to the 10,700 range, but only stayed there briefly and has since rallied to 11,450 level on strong volume.
(11) This was sparked by the Fed's bailout plan for Fannie and Freddie, if needed. The rebound from the 10,700 range was indeed critical, as there was very little support down to the 10,200 level.
Why did I rehash the painful events of the past?
Because it is important to keep in mind how the market responded to events. Just like we look at previous prices to measure moving averages and volatility, we must also retrace previous market sentiment. Now let's consider some basic trend analysis. As you can see, the Dow made an all-time high in October 2007. Since then, it has made lower lows and lower highs, typical of a downward trend. But how far and how long will this bear market last? First of all, we need to remember that the previous bullish rally was quite fast, occurring over about 20 months. In fact, the lion's share happened in 6 months (May to October 2007) for about 18% gains. What does that mean? Well, in my opinion, it means the bullish rally was not that valid. Remember, price validity strengthens with time.
If we look where the Dow is now, it's easy to see that it hit some fairly strong support around the 10,800 range. However, this support was just prior to the previous bull run which began in early 2007. In other words, if in fact, the previous bull run was an artifact, it is likely that the Dow has a way to go down before any long-term trend reversal.
Next we examine a 14-month chart of the Dow. As you can see, I've drawn the upper and lower trend lines. The dashed lower trend line illustrates very short-term extreme selling pressure I typically dismiss as noise. But as you can see, we've encountered three of these periods thus far, making what I would normally consider to be noise an important consideration.
The big question is where will the market head over the next several months. No one knows for certain, as this depends upon many variables and the timing of these variables. All we can do is look at the possibilities. The first thing I will say is that, based upon the three previous periods of extreme selling pressure, it is likely that we will see additional periods of these brisk sell-offs, but only if the downward trend remains in place. As for the downward trend, currently the Dow is trying to mount a strong rally up from the previous oversold level around 10,800. This rally was triggered by the Fed's bailout commitment to Fannie and Freddie, as well as additional positive news in the financial sector. Therefore, barring any further catastrophic events over the next several weeks, it looks as if the market could continue the current rally. But by how much and for how long? Once again, it is impossible to say without knowing in advance several variables.
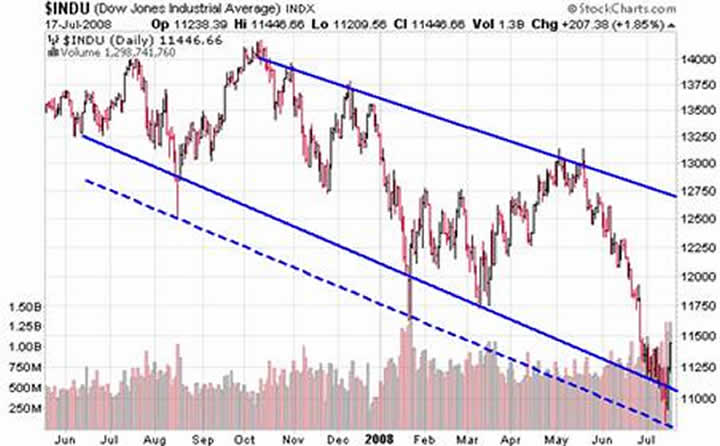
Assuming nothing major happens, it is entirely possible this rally could extend up to the 12,300 to 12,500 range over the next few months, perhaps sooner. But that does not mean we won't retest recent lows before making it all the way up. Regardless, if the market drops below recent lows made over the next few weeks, it could signal some really big problems.
Understand that even if the market continues the rally from here, it is still in a downward trend with no bottom in sight. Therefore, without significant evidence of a trend reversal after any rally, investors would be wise to trim positions once the rally tops out (which could be in the 12,300-12,500 range) and wait for a sell-off to lower lows. As the angle between the upper and lower trend lines widens, you should expect to see even more market volatility down the road, most of it on the declining side.
The key thing to remember about market forecasting is that it is dynamic and must be revised as things change. But if we keep the bigger picture in mind, it can help us make better short-term forecasts when using indicators such as RSI, MACD, put/call ratios, money flow and others. While the volatility indexes can certainly help determine big moves and reversals, I think it's much more important to look at events, such as the Fed's bailout plan and recent bank earnings. While everyone is different, I really only look at volatility indexes, put/call ratios and other indicators when I am lost and there is nothing more compelling to consider. Whatever you find works for you consistently is what you should use.
By Mike Stathis
http://www.apexvc.com
Copyright © 2008. All Rights Reserved. Mike Stathis.
Mike Stathis is the Managing Principal of Apex Venture Advisors , a business and investment intelligence firm serving the needs of venture firms, corporations and hedge funds on a variety of projects. Mike's work in the private markets includes valuation analysis, deal structuring, and business strategy. In the public markets he has assisted hedge funds with investment strategy, valuation analysis, market forecasting, risk management, and distressed securities analysis. Prior to Apex Advisors, Mike worked at UBS and Bear Stearns, focusing on asset management and merchant banking.
The accuracy of his predictions and insights detailed in the 2006 release of America's Financial Apocalypse and Cashing in on the Real Estate Bubble have positioned him as one of America's most insightful and creative financial minds. These books serve as proof that he remains well ahead of the curve, as he continues to position his clients with a unique competitive advantage. His first book, The Startup Company Bible for Entrepreneurs has become required reading for high-tech entrepreneurs, and is used in several business schools as a required text for completion of the MBA program.
Restrictions Against Reproduction: No part of this publication may be reproduced, stored in a retrieval system, or transmitted in any form or by any means, electronic, mechanical, photocopying, recording, scanning, or otherwise, except as permitted under Section 107 or 108 of the 1976 United States Copyright Act, without the prior written permission of the copyright owner and the Publisher. These articles and commentaries cannot be reposted or used in any publications for which there is any revenue generated directly or indirectly. These articles cannot be used to enhance the viewer appeal of any website, including any ad revenue on the website, other than those sites for which specific written permission has been granted. Any such violations are unlawful and violators will be prosecuted in accordance with these laws.
Requests to the Publisher for permission or further information should be sent to info@apexva.com
Books Published
America's Financial Apocalypse: How to Profit from the Next Great Depression . Condensed Ed. Copyright © 2007.
Cashing in on the Real Estate Bubble . Copyright © 2006.
America's Financial Apocalypse: How to Profit from the Next Great Depression . Copyright © 2006.
The Startup Company Bible for Entrepreneurs: The Complete Guide to Building Successful Companies and Raising Venture Capital . Copyright © 2004 and 2005.
Disclaimer: The above is a matter of opinion provided for general information purposes only and is not intended as investment advice. Information and analysis above are derived from sources and utilising methods believed to be reliable, but we cannot accept responsibility for any trading losses you may incur as a result of this analysis. Individuals should consult with their personal financial advisors before engaging in any trading activities.
Mike Stathis Archive |
© 2005-2022 http://www.MarketOracle.co.uk - The Market Oracle is a FREE Daily Financial Markets Analysis & Forecasting online publication.