


SPX New Highs, Correction Next?
Stock-Markets / Stock Markets 2016 Aug 20, 2016 - 06:22 PM GMTBy: Tony_Caldaro

 The market started the week at SPX 2184, rallied to 2194 on Monday, pulled back to 2169 by Wednesday, then rallied to end the week back at 2184. For the week the SPX/DOW slipped 0.05%, and the NDX/NAZ were mixed. On the economic front positive reports continued to outpace negative ones. On the downtick: the NY FED and building permits. On the uptick: the NAHB, housing starts, industrial production, capacity utilization, the Philly FED, leading indicators, the Q3 GDP estimate, plus weekly jobless claims improved. Next week’s reports are highlighted by the Q2 GDP, durable goods and more housing reports. Best to your week!
LONG TERM: uptrend
For the past several months we have been carrying two potential counts for the long term trend. The popular NYSE primary V, and the not so popular, if not unknown, SPX primary B count. In the past several weeks we have added a third count, which we detailed last week: the DOW primary III count. Actually the primary III count, quantitatively, also fits the SPX/NDX/NAZ/W5K. But does not fit the NYSE. The reason we suspect, also noted last week, is that the NYSE reflects more of a worldwide index, with its ADR’s, than a US index.
This week we are moving the DOW P3 count from an alternate to the 50/50 probability SPX/NYSE counts, and giving it an equal probability. This upgrades all three counts to a 33% probability. While all three counts continue to suggest higher prices ahead one in particular stands out.
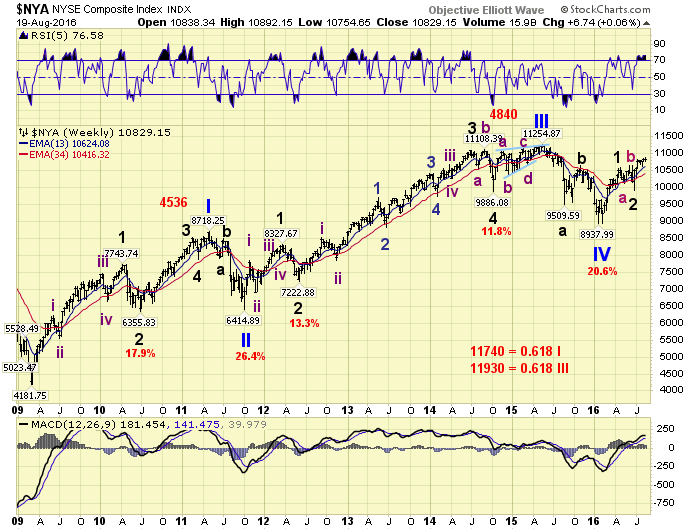
The NYSE P5 count fits better with the foreign indices than with the US market. And it is possible that the P3 and P4 in 2015 and 2016 are actually Major 1 and Major 2 of Primary III. It is not this count.
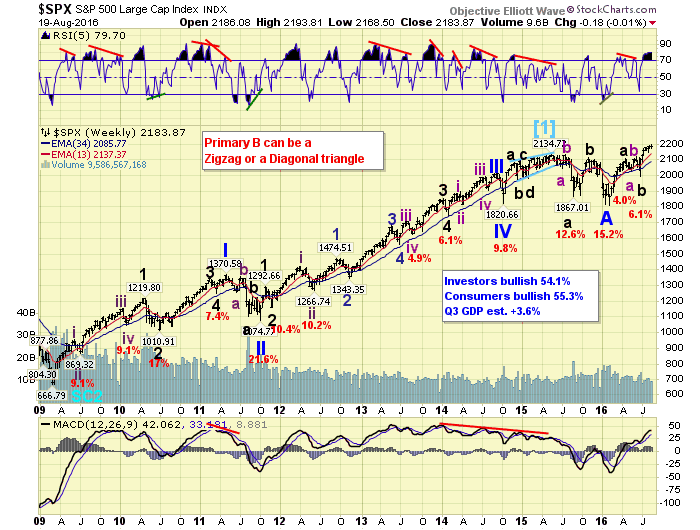
The SPX P B count still looks good, but historically it does not fit. Since 1932 there was only one time that a B wave made new all time highs, and that was in 1980 and only by 1%. At this week’s high the SPX was nearly 3% above the 2015 all time high. It is not this count.
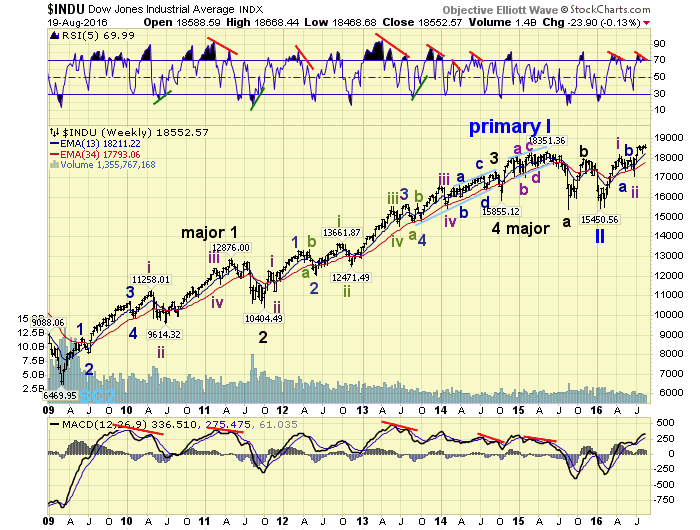
The DOW P3 count is relatively unknown in EW circles. But it fits quantitatively with the NDX/NAZ/SPX/W5K, and is supported by historically reliable technical indicators. It suggests Cycle wave [1] did not end in 2015, and it will not end with a NYSE P5 either. Cycle wave [1] will continue to unfold for a number of years, as Primary waves III, IV and V work their way higher. This is the count that makes the most sense. We caution, however, that the SPX needs to clear 2336 (1.618 x P A) before we will make this count the main count. As always feel free to choose which of the three counts fits your particular views.
MEDIUM TERM: uptrend may have topped
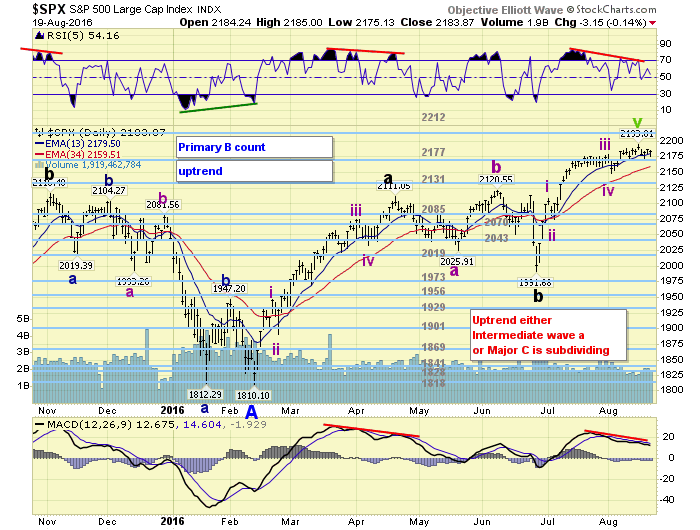
The current uptrend that began in late-June at the Br-exit low appears to have completed five waves up from that low [1992]: 2109-2074-2178-2148-2194. Since the third wave (104 pts.) was shorter than the first wave (117 pts.), we were expecting an even shorter fifth wave. At SPX 2194 it is about 6 points short of a 0.50 x wave 3 Fibonacci relationship. So this one is quite short, but close to our minimum of SPX 2200 2 points.
Supporting this potential downtrend underway scenario are the abundance of negative divergences nearly across the board in the major indices. Daily charts in all the major indices are displaying negative divergences in the RSI and MACD. On the weekly charts the SPX/NDX/NAZ are quite overbought. The DOW weekly is displaying a negative RSI divergence, just like it did at the last uptrend high.
Should a downtrend be underway we would expect the market to find support between waves 1 and 2 of this uptrend SPX: 2074 and 2109. This would amount to about a 5% correction from the SPX 2194 high. Medium term support is at the 2177 and 2131 pivots, with resistance at the 2212 and 2252 pivots.
SHORT TERM
While waves 1 and 3 of this uptrend counted quite well impulsively, this fifth wave has been a choppy affair. We have counted from the SPX 2148 wave 4 low: 2188-2172-2194. Then the market dropped to SPX 2169, rallied to 2187, and dropped to 2175. Quite sloppy activity that looks mostly corrective.
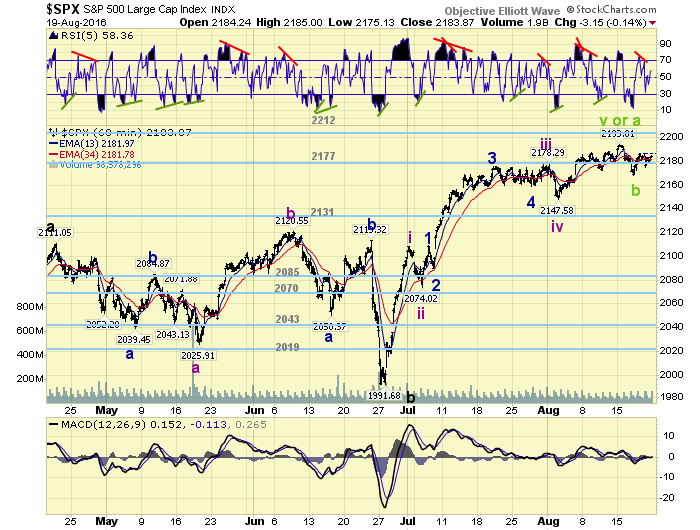
Since the pattern for the fifth wave is not clear it is possible it could move marginally higher to complete an ending diagonal: wave a 2194, wave b 2169, wave c underway. This pattern would likely top around SPX 2200. Or the uptrend actually ended at SPX 2188, and everything after that is part of the next downtrend. Until the SPX actually declines to 2148 again the short term outcome is a bit uncertain. Either way a downtrend is underway, or should be underway soon. Short term support remains at the 2177 and 2131 pivots, with resistance at the 2212 and 2252 pivots. Short term momentum ended the week at neutral.
FOREIGN MARKETS
Asian markets for the week were mixed and ended about unchanged.
European markets were all lower and lost 2.5%.
The Commodity equity group were mixed but gained 0.8%.
The DJ World index lost 0.1%.
COMMODITIES
Bonds continue to downtrend and lost 0.5% on the week.
Crude soared 10.4% on the week.
Gold is still in an uptrend and gained 0.2%.
The USD is still in a downtrend and lost 1.3%.
NEXT WEEK
Tuesday: new home sales. Wednesday: FHFA housing prices and existing home sales. Thursday: weekly jobless claims and durable goods orders. Friday: Q2 GDP 2nd est. +1.1%, consumer sentiment, and a Jackson Hole speech from FED chair Yellen.
CHARTS: http://stockcharts.com/public/1269446/tenpp
After about 40 years of investing in the markets one learns that the markets are constantly changing, not only in price, but in what drives the markets. In the 1960s, the Nifty Fifty were the leaders of the stock market. In the 1970s, stock selection using Technical Analysis was important, as the market stayed with a trading range for the entire decade. In the 1980s, the market finally broke out of it doldrums, as the DOW broke through 1100 in 1982, and launched the greatest bull market on record.
Sharing is an important aspect of a life. Over 100 people have joined our group, from all walks of life, covering twenty three countries across the globe. It's been the most fun I have ever had in the market. Sharing uncommon knowledge, with investors. In hope of aiding them in finding their financial independence.
Copyright © 2016 Tony Caldaro - All Rights Reserved Disclaimer: The above is a matter of opinion provided for general information purposes only and is not intended as investment advice. Information and analysis above are derived from sources and utilising methods believed to be reliable, but we cannot accept responsibility for any losses you may incur as a result of this analysis. Individuals should consult with their personal financial advisors.
Tony Caldaro Archive |
© 2005-2022 http://www.MarketOracle.co.uk - The Market Oracle is a FREE Daily Financial Markets Analysis & Forecasting online publication.