


US Drives Global Economic Growth
Economics / Global Economy Mar 01, 2017 - 04:02 PM GMTBy: Chris_Vermeulen

 The US is back in the driver seat again as a sustained and growing economic powerhouse – the Trump Economy. Since the November 2016 elections, the US economic data and outlook have been driving investment in US equities as well as select foreign investment opportunities. The reduction in regulations and business friendly Trump administration seems to have unleashed the hoard of cash and opportunity of the past 7+ years. US and foreign business are, again, “wheeling and dealing” with the intent of generating greater profits and more opportunities.
This is the reason I believe the US, as well as certain foreign partners, will see nearly immediate and direct advancement of economic objectives. The amount of capital that could be unleashed over the next 2 years could be well in excess of $2 Trillion as related to business investment, consumer-driven sales and expanded manufacturing capacity will likely drive the US economy into a new leadership role focused on renewed opportunity and activity.
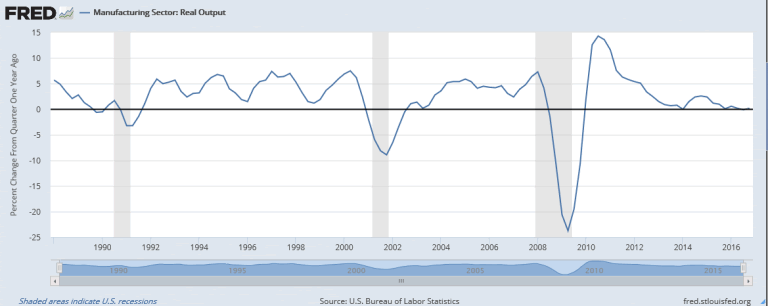
US Manufacturing has recently been in a state of decline since late 2011. I attribute this to uncertainty related to US policies and leadership. The graph, below, does not show the opportunity I see in the future expansion, but it does show that throughout historical periods of economic expansion, relative growth ratios tend to hover near +2.6% to +5.7%. This level of expansion, historically, would relate to the US economy feeling optimistic about future capabilities as well as increasing earning potential.
US Manufacturing Output Chart
Manufacturing will likely grow to near greater than +1% for Q1 2017
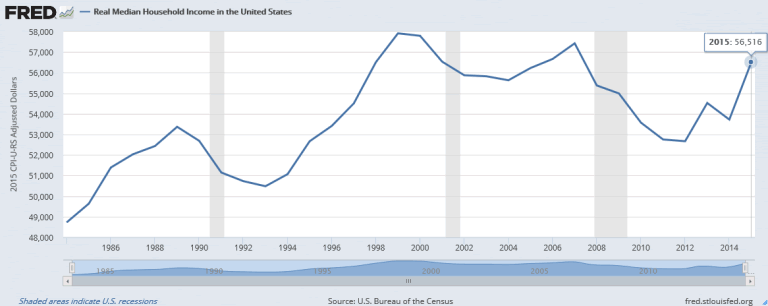
Keep the two functions in mind, as opportunities increase and the US economic activity increases, typically hiring and earnings increase as well. This is a sign of a healthy growth phase that may, as it seems it always does, spill over into other foreign markets. Much like the last 1990s and 2003~2006 US economic expansion phases, the historical rates of expansion averaged +4~5%. The contraction periods (recessions : 2001 & 2008) were deep and dangerous, yet the growth phases were lengthy and substantial. Household income growth was a key factor for extended periods of economic expansion.
FRED_MedHHIncome Chart
US Household Income Rising Sharply
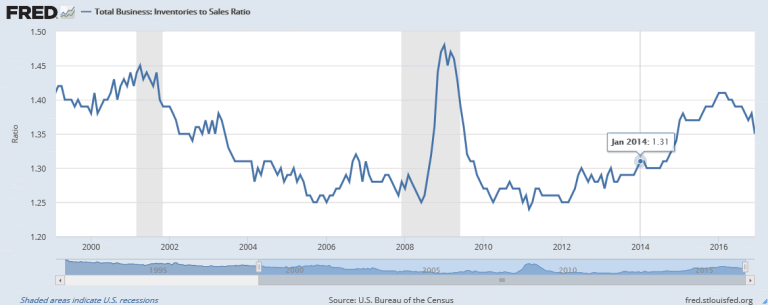
As business activity increases, Inventory To Sales Ratios decrease. The rational behind this factor is that sales volumes increase and inventories decrease in relation to new sales activities. Thus, products start flying out of the warehouses and off the shelves. Every US economic expansion phase has been paired with decreasing Inventory To Sales Ratios historically.
TtlBusInventory2SalesRatio Chart
Sharp increase in sales (Decreasing Inventory) after November 2016 elections
In short, this looks like “lift-off” for the US economy – at least for the immediate term perspective. The concerns for investors are still very evident in some of the following graphs. My opinion that the US is still, and has been for decades, the sole driving force behind much of the global economic expansion phases is based on the concept that the US, along with key partners, are the strongest and most mature economies on the planet. I consider most of the immediate partners to the US economy as Japan, Canada, Germany and Great Britain. I’m certain that many of you could add in 2 or 3 others, but I continue to focus on the core elements of the global economic process. Because none of the other global economies are, in my opinion, capable of functioning well without the economic impetus of the four mature growth economies, I continue to believe these four are, and have been, the drivers of global economic growth.
The following chart shows why I believe a dramatic change in US economic activity will drive some level of increased economic activity throughout the world. The combined European and Asian GDP Output graph shows severe contraction in 2013~2015. I can only assume the continued contraction of this measurement of economic activity continued in 2016. An increase of 10~20% of this value would result in a nominal overall increase compared to recent highs. It would take an increase of over 70% for this measurement of economic output to be restored to 2012~2013 levels – yikes!
GDP_EuropAsia Chart
Europe & Asia show sharp declines in economic activities
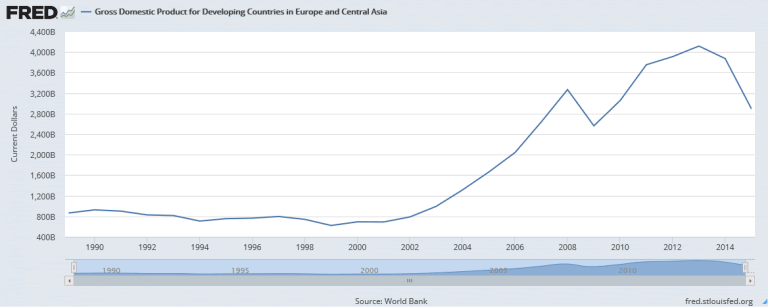
I attribute much of the GDP decreases in Europe and Asia to two factors; lack of economic expansion in the US and difficult/uncertain global economic policies in Europe and Asia. As the earlier US Manufacturing Output chart shows, the US economic has only recently started to expand. This is related to fears and uncertainty as related to the US election cycle (at least in part). The recent BREXIT news as well as other issues that continue to plague Europe are also key driving factors.
Additionally, more and more frequent news is relating economic concerns and excessive debt levels in China. I can attest that China’s economic reach is far and wide in most of Asia. Any crisis originating in China will result in mini-crisis events throughout most of Asia and parts of Europe. This is, again, why I believe continued strength in the US markets will drive US equities and economies to new highs while any “spill-over” may begin to improve foreign markets as well. But we’ll have to wait for that “spill-over” event to actually start to happen before we see any increased valuations or activity.
European Economic Policy Uncertainty Index Chart
Europe in the midst of uncertainty and constricting economic leadership
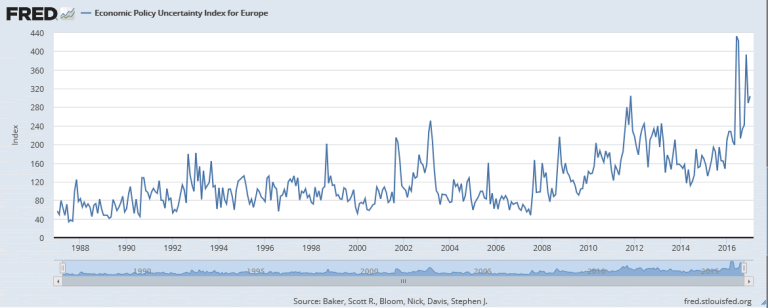
How does this relate to me, an active trader? First off, it means I should be focusing on core US equity opportunities and focusing on uncertainty related commodity markets (Gold, Silver, Oil, Gas and others). The uncertainty throughout most of the developed world will drive certain commodities to increased valuations. What has recently happened in India with regards to currencies is already driving global events in precious metals and demand for alternate paper currencies. What happens in France, soon, may likely drive further impetus for increasing valuations in commodities, equities and other markets. The supply data in regards to OIL and GAS is pushing a message that oil may drop to near $30 again. Things are changing quickly and we need to be ready to act and profit from these moves.
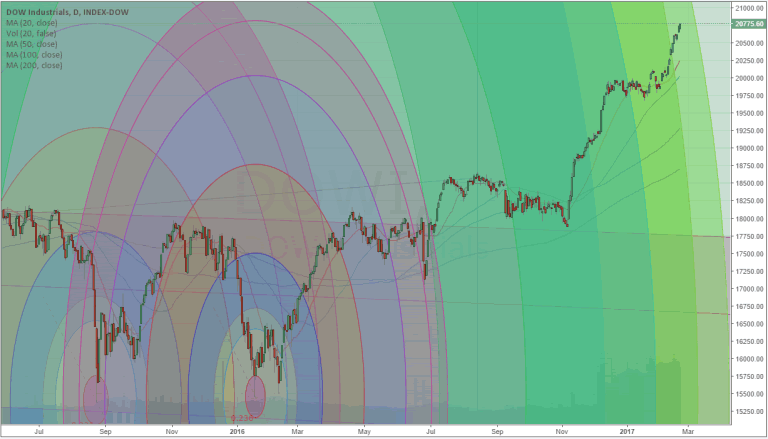
US DOW Chart
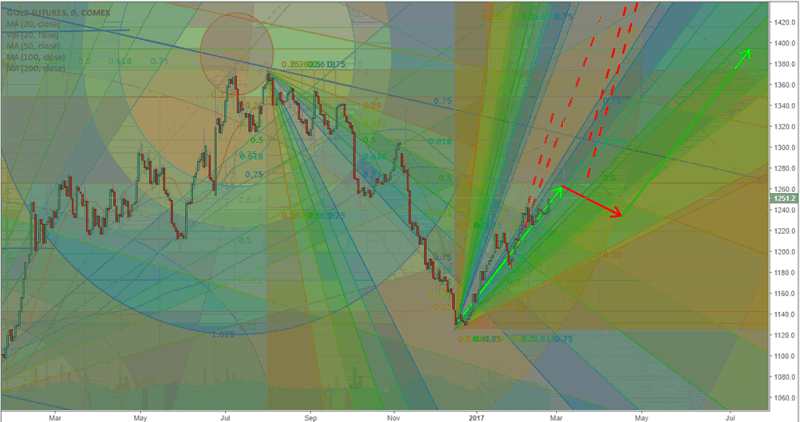
Gold Chart
The opportunities in foreign markets and in foreign equities will arise again in the future. I can’t predict when, but I can predict that any further increased US economic activity will have a “spill-over” effect on foreign markets and will drive increase valuations – unless something acts to destroy that alignment going forward.
I keep my members alerted to these opportunities and provide more detailed analysis and trading triggers through ATP . If you would like to continue to receive my research and analysis, please take a moment to visit ActiveTradingPartners.com to see how I can help you to achieve greater success. Some of my most recent calls have been outstanding like:
UGAZ 10.7% Profit (Feb 21-23)
ERX 7.7% Profit (Feb 8-9th)
NUGT 112%Profit (Dec 16 – Feb 8th)
All the trades are based on my Momentum Reversal Method (MRM) trading system.
In short, the US stock market is back in full blown bull market with Trump re-energizing things. While I feel a short-term correction is due any day, it is just that, a short-term pullback followed by higher prices into June/July.
Follow my lead and start making money every month with www.ActiveTradingPartners.com
John Winston
Co-Author: Chris Vermeulen
www.ActiveTradingPartners.com
Chris Vermeulen
Chris Vermeulen is Founder of the popular trading site TheGoldAndOilGuy.com. There he shares his highly successful, low-risk trading method. For 7 years Chris has been a leader in teaching others to skillfully trade in gold, oil, and silver in both bull and bear markets. Subscribers to his service depend on Chris' uniquely consistent investment opportunities that carry exceptionally low risk and high return.
Disclaimer: Nothing in this report should be construed as a solicitation to buy or sell any securities mentioned. Technical Traders Ltd., its owners and the author of this report are not registered broker-dealers or financial advisors. Before investing in any securities, you should consult with your financial advisor and a registered broker-dealer. Never make an investment based solely on what you read in an online or printed report, including this report, especially if the investment involves a small, thinly-traded company that isn’t well known. Technical Traders Ltd. and the author of this report has been paid by Cardiff Energy Corp. In addition, the author owns shares of Cardiff Energy Corp. and would also benefit from volume and price appreciation of its stock. The information provided here within should not be construed as a financial analysis but rather as an advertisement. The author’s views and opinions regarding the companies featured in reports are his own views and are based on information that he has researched independently and has received, which the author assumes to be reliable. Technical Traders Ltd. and the author of this report do not guarantee the accuracy, completeness, or usefulness of any content of this report, nor its fitness for any particular purpose. Lastly, the author does not guarantee that any of the companies mentioned in the reports will perform as expected, and any comparisons made to other companies may not be valid or come into effect.
Chris Vermeulen Archive |
© 2005-2022 http://www.MarketOracle.co.uk - The Market Oracle is a FREE Daily Financial Markets Analysis & Forecasting online publication.