


SPX New Highs Should be Next
Stock-Markets / Stock Market 2017 Mar 12, 2017 - 08:51 AM GMTBy: Tony_Caldaro

 The market started the week at SPX 2383. After a gap down opening on Monday the market declined to SPX 2355 by Thursday. Then a gap up opening on Friday carried the SPX to 2377, before ending the week at 2373. For the week the SPX/DOW lost 0.45%, and the NDX/NAZ were mixed. Economic reports for the week were mixed. On the downtick: consumer credit, wholesale inventories, the WLEI, the Q1 GDP estimate, plus weekly jobless claims and the trade deficit increased. On the uptick: factory orders, the ADP, export/import prices, monthly payrolls, plus the unemployment rate and budget deficit declined. Next week the FOMC meets, and there are reports on industrial production, housing, the CPI/PPI, retail sales, plus its options expiration Friday. Best to your week!
LONG TERM: uptrend
For the past couple of weeks we have been noting the SPX weekly RSI. Typically this indicator hits its highest overbought level during the third of a third wave during a bull market. Last Friday it hit its highest level in 13 years at 91.63. With this week’s pullback in the indices it dropped to 80.36. This is quite normal. Would expect to observe a negative divergence next when the current uptrend ends. Then during the next correction a drop down to around the oversold 30 level. As the rest of the bull market unfolds, uptrends should peak on lower overbought levels in the months ahead.
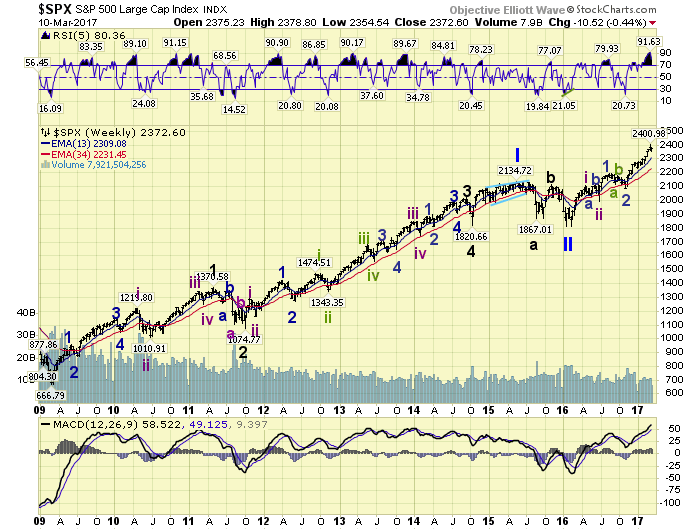
The long term count remains unchanged. A Super Cycle wave 2 low in 2009, a Primary wave I high in 2015, and a Primary wave II low in 2016. Major wave 1 of a Primary wave III bull market is currently underway. Impulsive Major waves divide into five Intermediate waves, and Intermediate waves divide into five Minor waves. Intermediate waves i and ii completed in April and June at SPX 2111 and SPX 1992 respectively. Minor waves 1 and 2 completed in August and November at SPX 2194 and SPX 2084 respectively. A rising Minor wave 3 uptrend has been underway since then.
MEDIUM TERM: uptrend
The Minor wave 3 uptrend started in early November, just before the election, at SPX 2084. Last Wednesday, March 1st, it hit a temporary high of SPX 2401. This uptrend is not only the longest of this bull market, four months, it has also gained the most SPX points: 317. The previous two uptrends were both two months long and gained 301 and 202 points respectively. This is typical third wave activity.
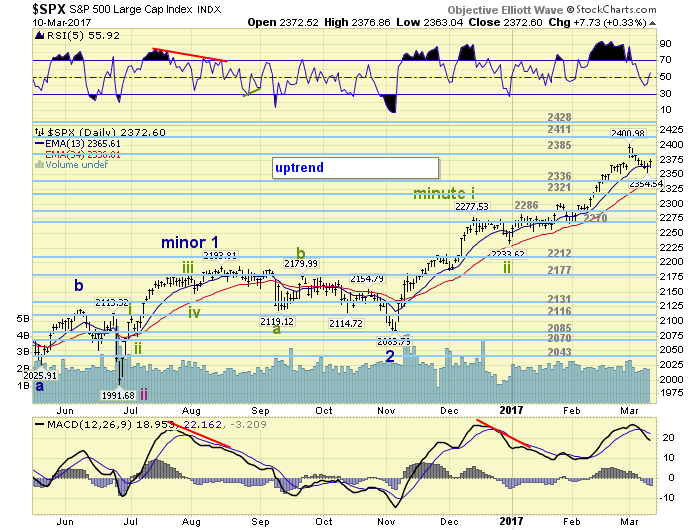
Minor wave 1 divided into five minute waves, and Minor wave 3 is doing the same. While Minor wave 1’s minute waves were relatively short, Minor wave 3’s minute waves are much longer. Minute i topped in mid-December at SPX 2278, and Minute ii bottomed in late-December at SPX 2234. Minute iii of Minor 3 has been underway since then. When Minute iii concludes we should see a Minute iv pullback, then a Minute v rally to new highs to end this Minor 3 uptrend. Medium term support is at the 2336 and 2321 pivots, with resistance at the 2385 and 2411 pivots.
SHORT TERM
Minute wave iii is dividing into five Micro waves, just like Minute wave i. Due to the length of this uptrend, Microwave 3 is dividing into five Nano waves. With the thrust of this entire uptrend occurring recently during Nano wave iii. As you can observe in the chart below Micro waves 1-2 have completed, along with Nano waves i-ii-iii and likely iv at Thursday’s SPX 2355 low. This count suggests the market could become a bit volatile as Nano v completes Micro 3 at new highs, Micro 5 completes Minute iii at new highs, and finally Minute v completes the Minor 3 uptrend at new highs.
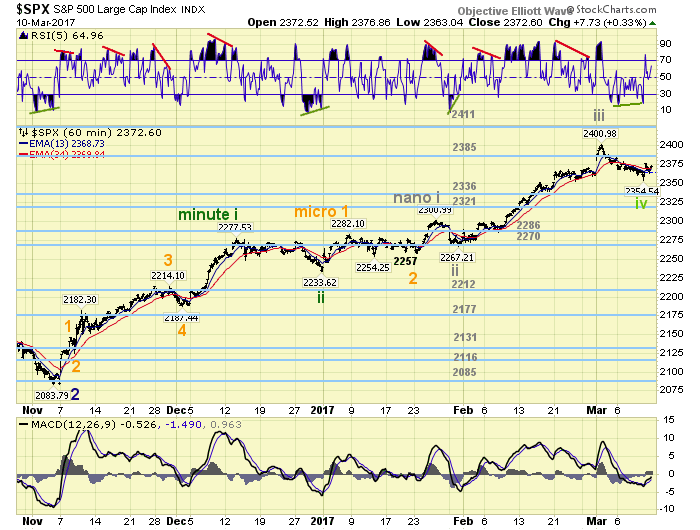
The DOW count, which can be found using the chart link below, suggests the market just completed Micro wave 3 at the March 1st high. It does not have the Nano wave subdivisions. And Microwave 4 likely bottomed at Thursday’s lows. This count suggests the next series of new highs will complete Minute iii. Then after a Minute iv pullback, Minute v would complete the Minor 3 uptrend. We will continue to keep an eye on both counts as this uptrend unfolds. Short term support is at SPX 2353/55 and the 2336 pivot, with resistance at the 2385 pivot and SPX 2401. Short term momentum ended the week above neutral. Best to your trading on options expiration week.
FOREIGN MARKETS
Asian markets were mostly higher and gained 0.3% on the week.
European markets were mixed and gained 0.2%.
The DJ World index lost 0.4%, and the NYSE lost 0.8% on the week.
COMMODITIES
Bonds are in a downtrend and lost 0.5% on the week.
Crude is also in a downtrend and lost 9.1%.
Gold is in a downtrend too and lost 2.1%.
The USD is in an uptrend but lost 0.5%.
NEXT WEEK
Tuesday: the PPI. Wednesday: the CPI, retail sales, NY FED, business inventories and the FED rate decision (est. +25bps). Thursday: housing starts, building permits, weekly jobless claims, and the Philly FED. Friday: industrial production, consumer sentiment and options expiration. Best to your weekend and week!
CHARTS: http://stockcharts.com/public/1269446/tenpp
After about 40 years of investing in the markets one learns that the markets are constantly changing, not only in price, but in what drives the markets. In the 1960s, the Nifty Fifty were the leaders of the stock market. In the 1970s, stock selection using Technical Analysis was important, as the market stayed with a trading range for the entire decade. In the 1980s, the market finally broke out of it doldrums, as the DOW broke through 1100 in 1982, and launched the greatest bull market on record.
Sharing is an important aspect of a life. Over 100 people have joined our group, from all walks of life, covering twenty three countries across the globe. It's been the most fun I have ever had in the market. Sharing uncommon knowledge, with investors. In hope of aiding them in finding their financial independence.
Copyright © 2017 Tony Caldaro - All Rights Reserved Disclaimer: The above is a matter of opinion provided for general information purposes only and is not intended as investment advice. Information and analysis above are derived from sources and utilising methods believed to be reliable, but we cannot accept responsibility for any losses you may incur as a result of this analysis. Individuals should consult with their personal financial advisors.
Tony Caldaro Archive |
© 2005-2022 http://www.MarketOracle.co.uk - The Market Oracle is a FREE Daily Financial Markets Analysis & Forecasting online publication.