


UK House Prices Forecast General Election 2017 Conservative Seats Result
ElectionOracle / UK General Election Jun 03, 2017 - 06:41 AM GMTBy: Nadeem_Walayat

 The polling establishment and the mainstream media had in unison proclaimed the 2015 general election was too close to call, one where the Labour and Conservative parties were neck and neck and where even if the Conservatives managed to pull a handful of seats ahead would still lose by default as they would not be able to form a majority even with Lib Dem support and therefore the Labour party appeared destined to win the 2015 general election, all of which was based on a year of opinion polls that consistently presented this consensus view right up until the polls closed!
As a reminder the consensus was for the Conservatives to win just 270 seats, where even the BBC's exit poll AFTER the polls closed at 10pm proved WRONG by forecasting the Conservatives would FAIL to win an outright majority on 316.
Instead, the reality proved to be the exact opposite as instead of the Ed Milliband walking into No 10 we had David Cameron racing back to No 10 before the locks were changed and where this video explained in detail why the opinion pollsters got the UK general election 2015 so badly wrong which was contrary to my long-standing expectations for a probable Conservative outright election win.
UK House Prices Accurately Forecast 2015 Election Result
My market skewed perception had accurately forecast the outcome of the UK General Election based on my house prices trend trajectory forecast a good 18 months before voting day!
30 Dec 2013 - UK House Prices Forecast 2014 to 2018, Inflation, Trend Trajectory and General Election 2015
UK General Election Forecast 2015
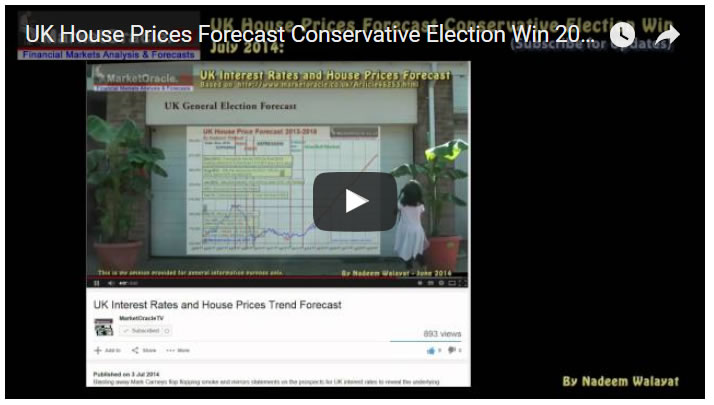
In terms of the 'fixed' May 2015 general election, the implications of 10% per annum house price inflation for another 18 months, that builds on the housing bull market of the previous 12 months and on the embryonic bull market of 2012 are that probability strongly favours an outright Conservative election victory.
The following graph attempts to fine tune the outcome of the next general election by utilising the more conservative current house prices momentum of 8.5% which has many implications for strategies that political parties may be entertaining to skew the election results in their favour.
In conclusion a May 2015 general election at an average house price inflation rate of 8.5% would result in a Conservative overall majority of at least 30 seats. Therefore this is my minimum expectation as I expect UK house prices to start to average 10% per annum from early 2014 with my actual forecast converging towards average UK house prices breaking to a new all time high just prior to the May 2015 general election which would be a significant boost for housing market sentiment and thus the Conservative's election prospects.
My following video of 6th January 2014 further illustrated my house prices based UK general election forecast:
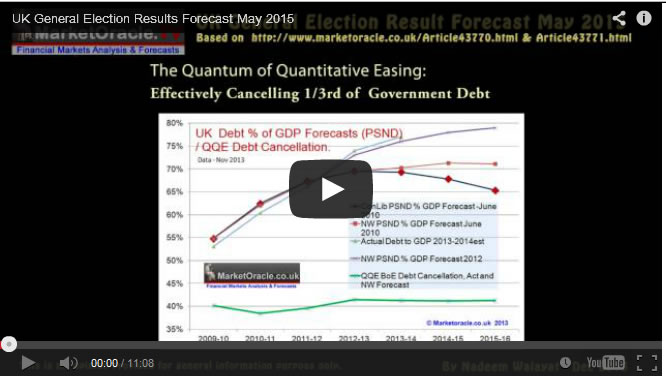
Election 2015 Forecast Outcome
As the following video illustrates the final house prices momentum data analysis just prior to the election on the 1st of May 2015 fine tuned the forecast to the Tories winning a single digits majority, against the actual outcome of an 10 seat majority that no one saw coming, as even after the polls closed the BBC's exit poll predicted a hung parliament.
Therefore in this unique analysis representing a complete departure from the polls based nonsense I will take a look at what my house prices 5 year trend forecast and momentum analysis predicts for outcome of this general election.
UK House Prices 5 Year Forecast 2014 - 2018
It is now 3 1/2 years since excerpted analysis and the concluding 5 year trend forecast from the then forthcoming UK Housing Market ebook was published:
30 Dec 2013 - UK House Prices Forecast 2014 to 2018, The Debt Fuelled Election Boom
UK House Prices Forecast 2014 to 2018 - Conclusion
This forecast is based on the non seasonally adjusted Halifax House prices index that I have been tracking for over 25 years. The current house prices index for November 2013 is 174,671, with the starting point for the house prices forecast being my interim forecast as of July 2013 and its existing trend forecast into Mid 2014 of 187,000. Therefore this house prices forecast seeks to extend the existing forecast from Mid 2014 into the end of 2018 i.e. for 5 full years forward.
My concluding UK house prices forecast is for the Halifax NSA house prices index to target a trend to an average price of £270,600 by the end of 2018 which represents a 55% price rise on the most recent Halifax house prices data £174,671, that will make the the great bear market of 2008-2009 appear as a mere blip on the charts as the following forecast trend trajectory chart illustrates:

The most recent UK average house prices data for April 2017 (£219,649), has house prices effectively flat lining for the first 4 months of this year, showing a 8% deviation against the forecast trend trajectory, which if it continues to persist then in terms of the long-term trend forecast for a +55% rise in average UK house prices by the end of 2018 would then translate into a 11.4% reduction in the forecast outcome to approx a +44% rise by the end of 2018.
I will take a detailed look at the prospects for UK house prices after the UK General Election.
UK House Prices Momentum
UK house price momentum has been steadily falling since Mid 2016, falling to the current low of just +2.6% in the wake of BrExit uncertainty after a brief rally into December 2016 towards 7%.
Whilst there are no signs of recovery given the uncertainty of the general election. Nevertheless summer months tend to be the best months for UK house price inflation and so the momentum graph should be bottoming out around the time of the election.
UK House Prices General Election Forecast
In terms of the forecast outcome, then it would have been marginally better to have the May house prices data which unfortunately won't be released until the 7th of June. However, indications from other indices such as Nationwide are that house prices were little changed for May.
The key drivers of the house prices positive or negative wealth effect in this election are UK house prices over the following time periods.
| Year to April 2017 | +2.6% |
| Year to April 2016 | +7.8% |
| 4 year bull market average | +9.2% |
| Weighted average | +5.4% |
The weighted average is in favour of the most recent data as having the most impact on voter behaviour.
Considering the 2 key UK house price momentum averages gong into the election of +2.6% for the year to date and +5.4% for the weighted average. Then these are net positives for the incumbent party i.e. the Conservative government 'should' increase its seats majority.
However, house price momentum is FALLING so over the passage of time since the EU referendum the potential size of the increase in the Conservative majority has been gradually eroding i.e. it would have been much better for Theresa May to have called the election 6 months ago for say December or January when house prices momentum was rising towards 7% rather than for June 2017.
So the decline in house price momentum will result in a significant reduction in the size of the Conservative majority that will likely be nowhere near the likes of the 400+ seats that many in the mainstream press were bandying about just a couple of weeks ago!
Therefore UK house prices momentum is forecasting barely a dozen seat increase the Conservatives seats total from 330 to about 342 seats that converts into a Commons majority of 34, which again is a far cry from the 100+ seat majority that some still persist on.
So whilst it would have been much better for the Tories to have gone to the polls 6 months earlier when they could have achieved an majority of near 100 seats. However, given the current house prices trend trajectory then waiting another 6 months could have resulted in a hung parliament with a probable Labour - SNP Nightmare Coalition. So it looks like an overly cautious Theresa May has played it a little too safe by not going to the polls earlier, but still did not make the same mistake as Gordon Brown when he bottled out of calling a 2007 general election.
This is my last sub analysis in my BrExit General Election series ahead of my final forecast conclusion that pulls all of the disparate threads together to form a seats per party forecast. So ensure you are subscribed to my always free newsletter for this concluding analysis and to our youtube channel for videos in this and the BrExit War series.
http://www.marketoracle.co.uk/Article59252.html
By Nadeem Walayat
Copyright © 2005-2017 Marketoracle.co.uk (Market Oracle Ltd). All rights reserved.
Nadeem Walayat has over 25 years experience of trading derivatives, portfolio management and analysing the financial markets, including one of few who both anticipated and Beat the 1987 Crash. Nadeem's forward looking analysis focuses on UK inflation, economy, interest rates and housing market. He is the author of five ebook's in the The Inflation Mega-Trend and Stocks Stealth Bull Market series that can be downloaded for Free.


 Nadeem is the Editor of The Market Oracle, a FREE Daily Financial Markets Analysis & Forecasting online publication that presents in-depth analysis from over 1000 experienced analysts on a range of views of the probable direction of the financial markets, thus enabling our readers to arrive at an informed opinion on future market direction. http://www.marketoracle.co.uk
Disclaimer: The above is a matter of opinion provided for general information purposes only and is not intended as investment advice. Information and analysis above are derived from sources and utilising methods believed to be reliable, but we cannot accept responsibility for any trading losses you may incur as a result of this analysis. Individuals should consult with their personal financial advisors before engaging in any trading activities.
Nadeem Walayat Archive |
© 2005-2022 http://www.MarketOracle.co.uk - The Market Oracle is a FREE Daily Financial Markets Analysis & Forecasting online publication.