


A Generational Reset That Will Redistribute Wealth to the Bottom 60% Is Near
Economics / Demographics Nov 16, 2017 - 10:31 AM GMTBy: John_Mauldin

 Billionaire founder of top hedge fund Bridgewater Associates Ray Dalio got where he is by having keen insight into both human nature and economic trends.
Occasionally, he shares some of his wisdom publicly.
In one of his recent articles, Dalio argues that it is a serious mistake to think you can analyze or understand “the” economy because we now have two of them.
Wealth and income levels are so skewed between the top and the bottom that “average” indicators no longer reflect the average person’s experience or living conditions.
And that obscures the big picture when it comes to today’s prevailing economic and political trends.
The Top 40% vs. The Bottom 60%
Dalio has split the economy into the top 40% and bottom 60%, and quantified the split with some startling numbers. Just a sampling:
- The average household in the top 40% earns four times more than the average household in the bottom 60%.
- Real incomes for the bottom 60% have been either flat or down slightly since 1980.
- In 1980, the average top 40% household had six times more wealth than the average bottom 60% household. Now it is 10 times as much.
- Only about a third of the bottom 60% saves any of their income.
Dalio also found some very useful data I had never seen before: household income adjusted to show the impact of taxes, tax credits, and government benefits.
This adjustment gets closer to the resources people actually have available for living expenses, savings, and investment.
Splitting that data by the top 40% and bottom 60%, we see a sharply growing difference in the percentage changes since 1980. The top saw its after-tax net household income grow almost three times faster than household income for the bottom 60%, even including government transfer payments.
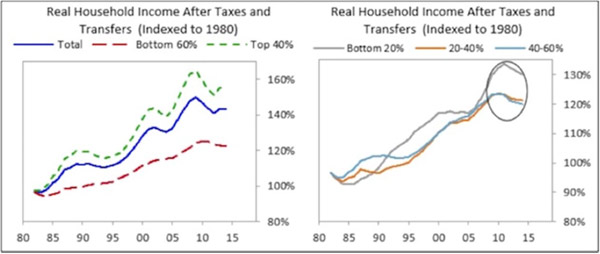
And note something in the right-hand side of the chart, which depicts income changes for the bottom 60% only, divided into three segments. There is a significant difference in the income growth of the middle 40–60% segment and the bottom 40%, too, and that difference accelerated during and after the Great Recession.
Think About That in the Context of Recent Political Trends
You see the problem here? The bottom 60% know their own experience. Thanks to the Internet and social media, the bottom 40% is particularly aware of it and increasingly resentful.
Note also that the lower ranks of the top 40% are not “wealthy” by any stretch. Anyone below the 80th percentile is probably struggling to some degree.
Since the 1980s, most of us at the top have believed that a rising tide would lift all boats. We were half-right: It has lifted all the boats but not at the same rate, and a good many boats have sprung holes and are taking on water. We’re now near the point where our differences in income and wealth are too great to ignore.
Think back 30 years. None of us would want to go back and live with that same technological base. All of our lives have dramatically improved. From health care to communications to entertainment to transportation and a host of other things, we are all better off.
But the key here is that no matter how much better our lives have become, those in the bottom 20 or 40 or 60 or 80% notice the relative differences between where they are and where the top 10% or 1% reside, and they can see those differences growing.
While the majority of those living in Africa, in some parts of Asia, and in the slums in Latin America would see the lives of what we call the poor in America as vastly superior to their own lifestyles, that is not who the bottom 20–40–60% of the income strata in the US are comparing their lives to.
It is simply human nature that we compare ourselves to those who have more, and that we want more for ourselves.
We Stand on the Verge of a Generational Reset
Look at the the chart below.
The red line is the share of US wealth owned by the bottom 90% of the population, and the green line is the share held by the top 0.1%.
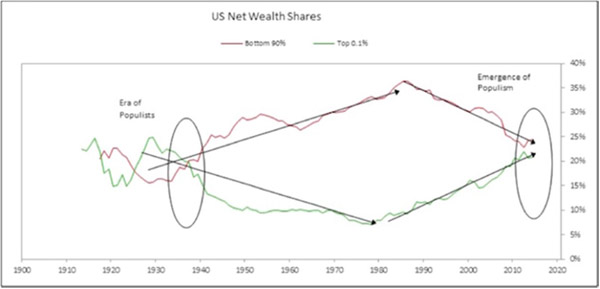
Now they are about the same, but notice the trend. The wealthiest 0.1% has been increasing its share of wealth since the 1980s. Meanwhile, the bottom 90% has been losing ground.
Looking back, we see a similar pattern in the 1920s—which dramatically reversed in the following decade. Then there was an almost 50-year period during which the masses gained wealth and the wealthy lost ground.
In the big picture, we see about a half-century when the net wealth gap widened in favor of the bottom 90%, followed by another 30 or so years in which the wealthiest gained ground while most of the population lost it.
It’s not a coincidence that populism emerged as a political force in both the 1920s–1930s and the 2010s.
In each case, people at the bottom could tell the economy wasn’t working in their favor. The best tool they had to do something about it was the vote, so they elected FDR then and Trump now.
The two are very different presidents, but both address the angriest voters of their eras.
The 10-year period in which the green line was above the red line included the Roaring 20s, the 1929 market crash, and the first part of the Great Depression. For the 0.1%’s share of the wealth, 1929 was roughly the high point.
Wealth lost in the crash sent their share plummeting. It has not fully recovered to this day, but it’s getting close.
Thinking about this situation, I can't help but correlate it to my friend Neil Howe's idea of a historical "Fourth Turning" every 80 years or so.
(A Fourth Turning is a time when society’s foundational institutions are challenged. The generation that is young adults at that time must face the challenge and hopefully overcome it. The so-called Greatest Generation did so by persevering through the Great Depression and fighting World War II. It may not be a war, but the Millennial Generation will face a similar test.)
It fits well with Dalio’s data. Neil said at my 2016 Strategic Investment Conference in Dallas that we are in the middle stages of that Fourth Turning, and he expects conditions to worsen from here.
As he points out, for almost 500 years, the last half of Fourth Turning has always encompassed the most tumultuous times in Anglo-Saxon history.
This time is likely to be no different…
Get one of the world’s most widely read investment newsletters… free
Sharp macroeconomic analysis, big market calls, and shrewd predictions are all in a week’s work for visionary thinker and acclaimed financial expert John Mauldin. Since 2001, investors have turned to his Thoughts from the Frontline to be informed about what’s really going on in the economy. Join hundreds of thousands of readers, and get it free in your inbox every week.
John Mauldin Archive |
© 2005-2022 http://www.MarketOracle.co.uk - The Market Oracle is a FREE Daily Financial Markets Analysis & Forecasting online publication.