


Math Behind Last Weeks Stock Market Crash
Stock-Markets / Financial Crash Feb 11, 2018 - 05:10 PM GMTBy: Chris_Vermeulen

 After surviving one of the biggest market rotations in the last 3+ years, we have been getting quite a bit of request for a detailed analysis of this move and asked what our specialized modeling systems are telling us is likely to happen. Our research team at Technical Traders Ltd. has put together this short reference of “the math behind the move” that will show you what is happening and the underlying price mechanics that are going to be driving prices in the future.
Now, before we get into the details of the mathematics of this recent rotation, we want to preface the fact that our current analysis indicates that the Tuesday low appears to be the ultimate low at this time and that future price activity will either confirm this or create an alternate price outcome. As we are going through the mechanics of this move, remember that we predicted a massive price advance for the beginning of 2018 that would result in a “relief pullback” near the end of January before finding new support and launching into an additional advance culminating in a price peak near March 15 (this was the furthest future point that our predictive modeling systems could identify at that time in December 2017). As of right now, our analysis was DEAD ON.
So, what do our predictive modeling systems tell us now and what should you be doing as investors/traders? Let’s get into the details – shall we?
This monthly chart of the NQ provides a pretty clear picture of the current Elliot Wave formations and presents a clear understanding that we are currently in a WAVE 5 expansion of a broader WAVE 3 move to the upside. These WAVE 5’s can be somewhat extensive and are often equal to or greater than the previous WAVE 3 move. Thus, we have just recently reached the EQUAL price range in the current WAVE 5 compared to the previous WAVE 3. This means we should be expecting a bit of rotation and consolidation near these levels before price determines if this WAVE 5 move will continue.
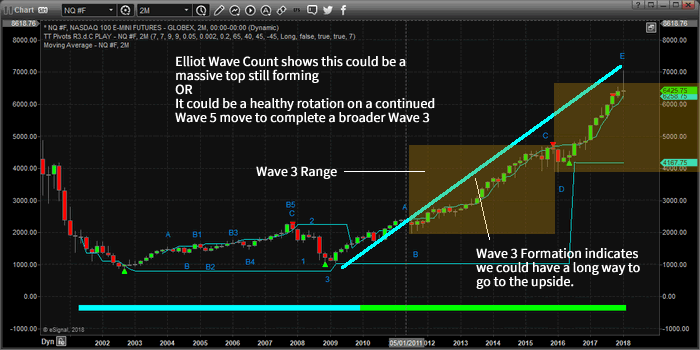
Given this mathematical and technical data as well as knowing that this current WAVE 5 could have further upside potential, we need to understand the potential for a deeper downside price retracement and understand the more micro modeling results.
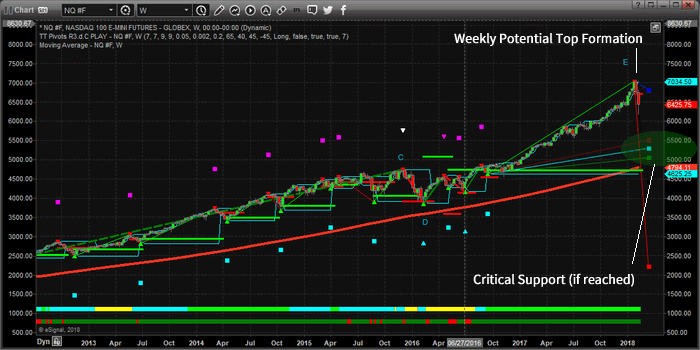
This next Weekly chart is using our Fibonacci/Elliot Wave modeling system that assists us in determining critical price levels and turning points. As or right now, on the hard right edge of this chart, we are seeing that the current price is warning of a moderately deep retracement that is setting up as long as the price stays below $6720. Additionally, it is showing very strong support near the $5000~5500 level. This modeling system tells us that if recent lows are breached, the change that prices would fall to near $5500 is fairly strong.
Again, remember that we are “potentially” nearing the end of WAVE 5. We don’t have any real confirmation of this move yet, and all we can do is be aware that WAVE 5 if this is the end, will create a short-term corrective wave (Intermediate Wave 4: down) that will end with the creation of a massive broader WAVE 5 higher. So, at this point, we have a healthy rotation that may turn into a WAVE 5 top.
Now that we’ve completed the MACRO analysis, we have to understand what the MICRO analysis and modeling systems are telling us. Remember, these two charts are Monthly and Weekly modeling systems that are showing us the very long term price potential (over many weeks, months or years). For a more immediate analysis of what we should expect over the next few days, we have to use other modeling systems which paint a very clear and exciting picture for us as traders. Tomorrow we will post PART 2 of this report showing you exactly where the markets are headed over the four weeks.
Remember, opportunities exist every week for traders and investors to take advantage of market rotation and key market moves. Please visit www.TheTechnicalTraders.com to learn more of what we offer our members and how we can assist you in staying ahead of the markets. You can also read all of our public research documents on our site as well as talk to a live representative if you like. We look forward to helping you find success in the future.
Get ready for some price recovery and be prepared for a moderate upside move before March 15.
Between my research team and I, we have 53 years experience in researching and trading makes analyzing the complex and ever-changing financial markets a natural process. We have a simple and highly effective way to provide our customers with the most convenient, accurate, and timely market forecasts available today. Our stock and ETF trading alerts are readily available through our exclusive membership service via email and SMS text. Our newsletter, Technical Trading Mastery book, and 3 Hour Trading Video Course are designed for both traders and investors. Also, some of our strategies have been fully automated for the ultimate trading experience.
Chris Vermeulen
www.TheTechnicalTraders.com
Chris Vermeulen has been involved in the markets since 1997 and is the founder of Technical Traders Ltd. He is an internationally recognized technical analyst, trader, and is the author of the book: 7 Steps to Win With Logic
Through years of research, trading and helping individual traders around the world. He learned that many traders have great trading ideas, but they lack one thing, they struggle to execute trades in a systematic way for consistent results. Chris helps educate traders with a three-hour video course that can change your trading results for the better.
His mission is to help his clients boost their trading performance while reducing market exposure and portfolio volatility.
He is a regular speaker on HoweStreet.com, and the FinancialSurvivorNetwork radio shows. Chris was also featured on the cover of AmalgaTrader Magazine, and contributes articles to several leading financial hubs like MarketOracle.co.uk
Disclaimer: Nothing in this report should be construed as a solicitation to buy or sell any securities mentioned. Technical Traders Ltd., its owners and the author of this report are not registered broker-dealers or financial advisors. Before investing in any securities, you should consult with your financial advisor and a registered broker-dealer. Never make an investment based solely on what you read in an online or printed report, including this report, especially if the investment involves a small, thinly-traded company that isn’t well known. Technical Traders Ltd. and the author of this report has been paid by Cardiff Energy Corp. In addition, the author owns shares of Cardiff Energy Corp. and would also benefit from volume and price appreciation of its stock. The information provided here within should not be construed as a financial analysis but rather as an advertisement. The author’s views and opinions regarding the companies featured in reports are his own views and are based on information that he has researched independently and has received, which the author assumes to be reliable. Technical Traders Ltd. and the author of this report do not guarantee the accuracy, completeness, or usefulness of any content of this report, nor its fitness for any particular purpose. Lastly, the author does not guarantee that any of the companies mentioned in the reports will perform as expected, and any comparisons made to other companies may not be valid or come into effect.
Chris Vermeulen Archive |
© 2005-2022 http://www.MarketOracle.co.uk - The Market Oracle is a FREE Daily Financial Markets Analysis & Forecasting online publication.