


Stock Market Bulls Last Stand?
Stock-Markets / Stock Markets 2018 Mar 18, 2018 - 05:54 PM GMTBy: Andre_Gratian

 Current Position of the Market
SPX: Long-term trend – The bull market is continuing with a top expected in the low 3000s.
Intermediate trend – The intermediate correction from 2872 could nowcontinue until May-June.
Analysis of the short-term trend is done on a daily basis with the help of hourly charts. It is an important adjunct to the analysis of daily and weekly charts which discusses the course of longer market trends.
Daily market analysis of the short term trend is reserved for subscribers. If you would like to sign up for a FREE 4-week trial period of daily comments, please let me know at ajg@cybertrails.com
The Bulls Last Stand?
Market Overview
Last week, I wrote the following:
“… some cycles … suggest that a consolidation should take place over the next few weeks. Minor cycle lows are due next week, and larger ones around mid-April. And then, the all-important 40-wk cycle is due in mid-May. So the forecast made above could be altered by some corrective action before we get the all-clear signal for a new high.”
By “the bulls last stand” I do not mean that we are at the top of the bull market (that may be reserved for the end of the year), only that there is a good chance that the correction is about to continue and pull prices lower in a retest of the 2533 low. The reason for that is the above quote from last week. The minor cycles did affect prices last week and could even continue to do so into Monday, but the more important ones that lie ahead should not only prevent a strong recovery in the coming weeks, but they should weigh on prices until May-June.
There is one more opportunity for the bulls to show some short-term strength and that is next week, with the help of minor cycles, and if the FOMC meeting has a bullish overtone. In that case, we could attempt to retest the recent high of 2802, but with the larger cycles increasingly bearish into April, this should be a bounce of limited potential.
Chart Analysis (These charts and subsequent ones courtesy of QCharts)
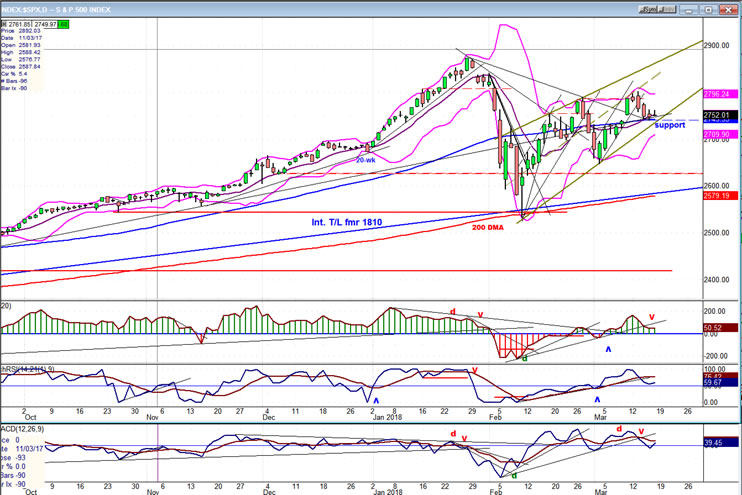
SPX daily chart
The bullish nature of the chart ended at 2800 when the index barely surpassed the previous high and came down hard on an important support level which combines trend lines, former congestion, and MAs. The short-term cyclical projection suggests that it should hold for a little longer, perhaps even into the end of the week, but the larger cycles due in April and then May/June should be a powerful deterrent against anything more than a near-term bounce.
After the initial correction from 2872 down to 2533, a strong rebound retraced 78% of the decline and after a pull-back, the uptrend resumed. It was now a question of how much more of a rally the bottoming cycles would permit and there was the possibility that we could even retest the former high of 2872 before turning down again. Last week’s action was a definite: enough! And now the bulls are once again vulnerable to another couple of months of weakness before the index can complete its intermediate correction and resume its uptrend. We’ll leave it at that for now and discuss the possibility for a much larger decline as the end of the year approaches.
The oscillators have already turned down and are holding just above the middle line. The next time they become negative, they will signal a resumption of the correction.
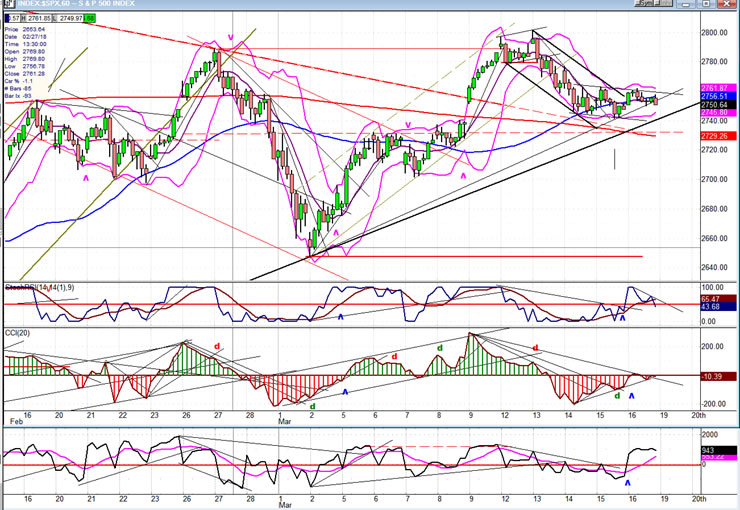
SPX hourly chart
Small cycles have kept the index down for the past few days, and this may even extend into Monday. Then, based on cycle activity alone, we should get a 3 or 4-day bounce, unless it is curtailed by the FOMC report due Wednesday. If it is favorable to the bulls, we could retest the recent high. When that is out of the way, the index will be vulnerable to reversing its short-term trend to challenge the support level once again. It would be surprising if it managed to hold the second time since the cycle due in April is capable of carrying a good punch under the right circumstances. In this case, it will be assisted by a larger cycle bottoming in May/June and, of course, its effect will be proportional to how much distribution has taken place above the 2740 level. We will probably not have a clear idea of its impact until later in the week, and that information will be passed on to subscribers as soon as a reliable estimate is available.
The support extends down to the dashed trend line which is drawn across the top of the consolidation level at about 2730. I have my doubts that it will be strong enough to arrest the next short-term decline, but one never knows! The market always has the final say.
Friday ended with a 7-point drop in the last two minutes of trading, probably the effect of options expiration week which may carry into Monday morning – or not! A minor cycle was ideally due to make its low on Friday, but it would not be unusual for it to extend another day.
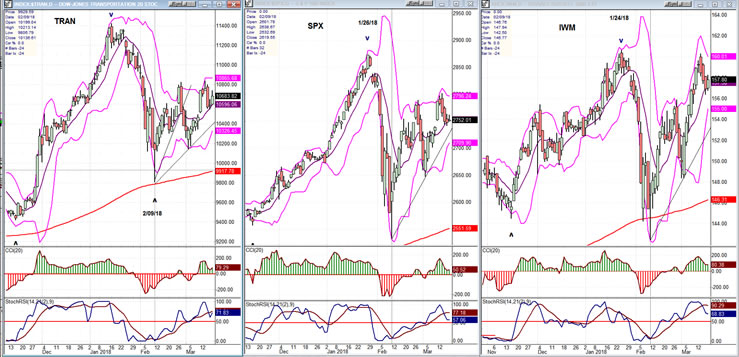
TRAN, IWM, SPX (daily charts)
The predictive divergence which occurs in the two leading indexes below only takes place at important market tops, but the rest of the time their performance can still be indicative of the SPX trend. IWM had a strong rally last week, but it seems to have been more related to the move of NDX -- unless its strength persists into next week. TRAN and SPX were more in tune and on Friday, SPX was actually the weakest performer.
UUP (dollar ETF)
UUP has had a second bounce off its green 30-DMA. I suspect that if it cannot extend its advance right away, the next time it pulls back, it will go through it.
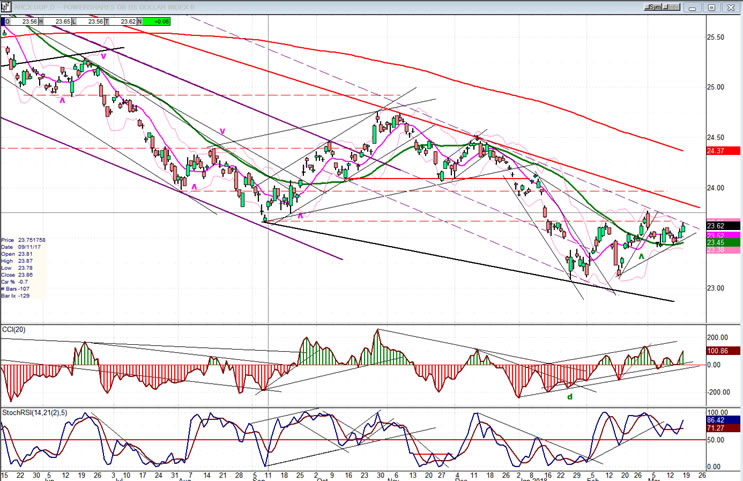
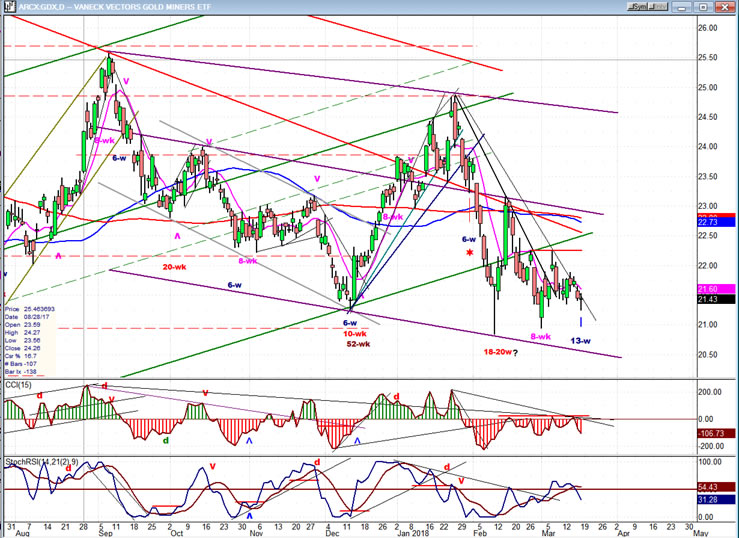
GDX (Gold miners ETF)
GDX should now be in the time slot of its 13-week cycle low, and Friday’s little dip which coincided with a little bounce in UUP may be the final low of the move, especially since GDX rallied into the upper part of its daily range by the close. Watch to see if it can overcome its last near-term high followed by a move above the red horizontal line. This would indicate that a rally has started.
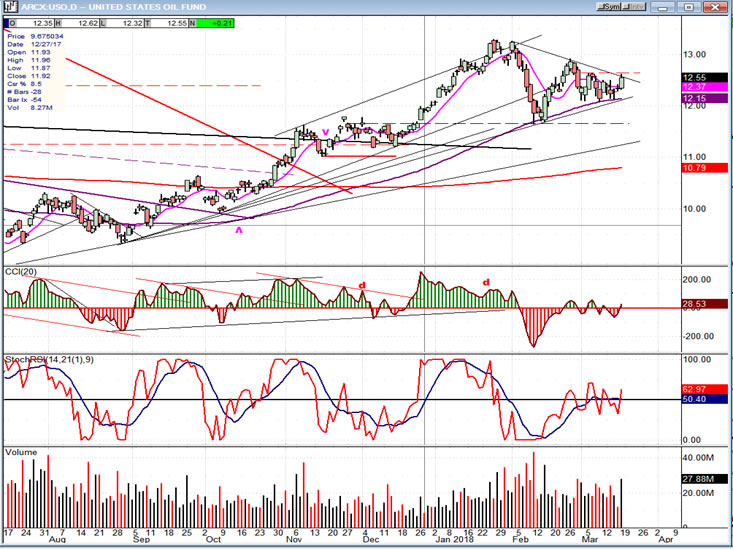
USO (United States Oil Fund)
After holding its 89-DMA, USO popped up on Friday, challenging its downtrend line and the former short-term high on a good increase in volume. This looks like a resumption of its uptrend after an orderly correction. If it can follow through with more buying next week, it could be ready to reach its next near-term objective of ~15.00 before the next consolidation takes place.
Summary
“SPX could end Friday’s strong rally on Monday and start a minor correction. Cycles are, essentially, negatively biased until the middle of May, so the current structure is a little uncertain -- but will define itself over the next few days and weeks. “
So far, the analysis has been correct and SPX’s performance during the past week looks like a prelude to a resumption of the correction and a retest of the low – but not before another bounce early next week!
Andre
For a FREE 4-week trial, send an email to anvi1962@cableone.net, or go to www.marketurningpoints.com and click on "subscribe". There, you will also find subscription options, payment plans, weekly newsletters, and general information. By clicking on "Free Newsletter" you can get a preview of the latest newsletter which is normally posted on Sunday afternoon (unless it happens to be a 3-day weekend, in which case it could be posted on Monday).
Disclaimer - The above comments about the financial markets are based purely on what I consider to be sound technical analysis principles uncompromised by fundamental considerations. They represent my own opinion and are not meant to be construed as trading or investment advice, but are offered as an analytical point of view which might be of interest to those who follow stock market cycles and technical analysis.
Andre Gratian Archive |
© 2005-2022 http://www.MarketOracle.co.uk - The Market Oracle is a FREE Daily Financial Markets Analysis & Forecasting online publication.