


When Will the First Big Stock Market Rally Start?
Stock-Markets / Stock Markets 2018 Dec 27, 2018 - 04:27 PM GMTBy: Troy_Bombardia

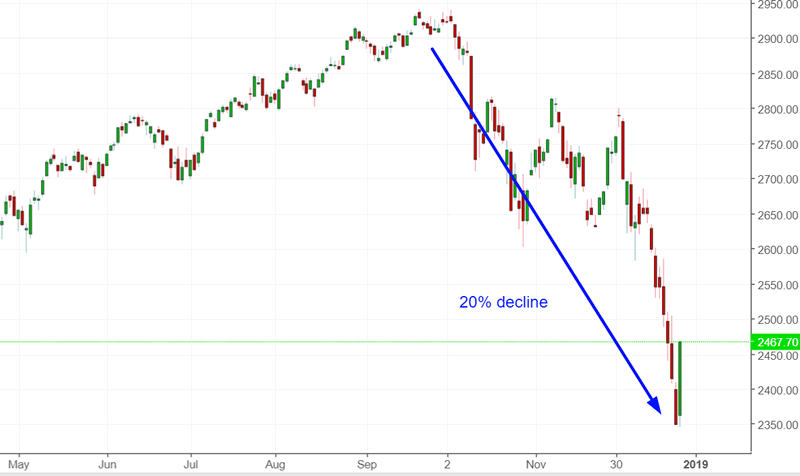
The S&P has now fallen -20%, the conventional definition for a “bear market” (We define “bear markets” as 33%+ declines that last at least 1 year. 15%+ declines = “big corrections”).
Go here to understand our fundamentals-driven long term outlook.
Let’s determine the stock market’s most probable medium term direction by objectively quantifying technical analysis. For reference, here’s the random probability of the U.S. stock market going up on any given day, week, or month.

*Probability ≠ certainty. Past performance ≠ future performance. But if you don’t use the past as a guide, you are walking blindly into the future.
When will the first big rally happen?
You can notice something very interesting in our market studies recently. While the market studies are consistently medium term bullish, they have never been consistently short term bullish.
Why?
Because the stock market is selling off at a once-in-a-decade speed right now.
During such times:
- The stock market “eventually” makes a big medium term rally. Whether that rally leads to a new all-time high or is followed by lower lows is yet to be seen.
- The stock market can go down more in the short term.
How much more can the stock market fall in the short term?
No one knows. When the market starts panic selling (e.g. right now), the potential range for a bottom is very wide. This is why David Tepper is starting to buy some stocks right now, but he’s not max long. (David Tepper is one of the few real experts.)
In an environment like this, the worst thing to do is to go all in, guns-blazing long.
- If you are lucky, you might catch the exact bottom.
- If you are unlucky, the stock market might fall another -10% in 2 weeks before it makes an vicious rally.
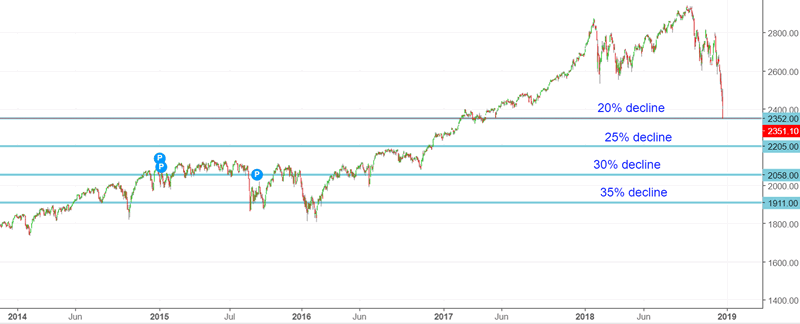
CNBC published good piece about what 20%+ declines in the stock market look like.
Since World War II, bear markets on average have fallen 30.4 percent and have lasted 13 months, according to analysis by Goldman Sachs and CNBC. When that milestone has been hit, it took stocks an average of 21.9 months to recover.
This statistic is a little misleading, because 20%+ declines vary massively in terms of MAGNITUDE. Some declines are 20% while others are 50%.
Let’s see how much 20%+ declines need to fall before the first big rally begins.
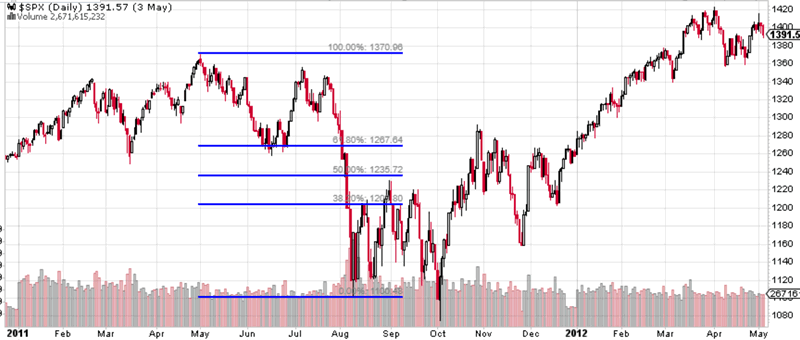
2011
The S&P fell 19.6% before making a big retracement that almost reached 50%
The total size of the decline was 21.5%
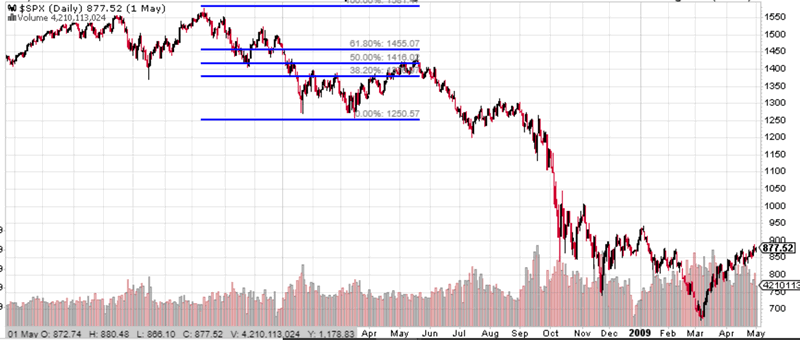
2008
The S&P fell 20.2% before making a big retracement that almost reached 50%
The total size of the decline was 57.7%
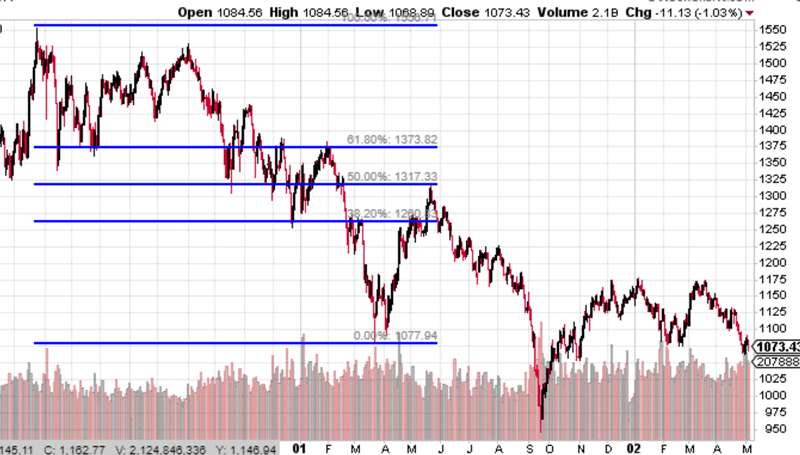
2001 (past the -20% mark)
The S&P fell 28% before making a big retracement that almost reached 50%
The total size of the decline was 50.4%
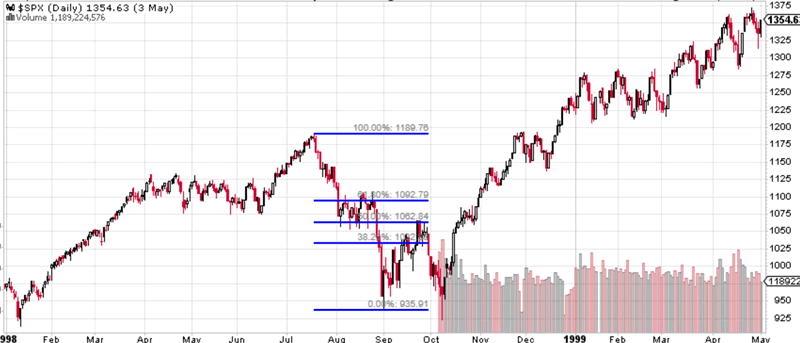
1998 (past the 20% mark)
The S&P fell 21% before making a big retracement that almost reached 50%
The total size of the decline was 22.4%
1998 (past the 20% mark)
The S&P fell 21% before making a big retracement that almost reached 50%
The total size of the decline was 22.4%
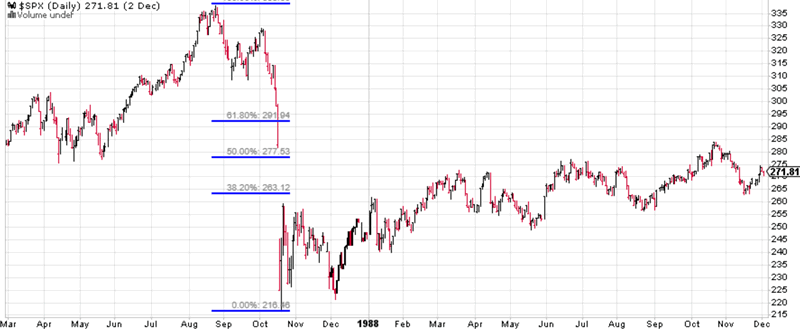
1987 (past the 20% mark)
The S&P fell 35.9% before making a small retracement that almost reached 38.2%
The total size of the decline was 35.9%
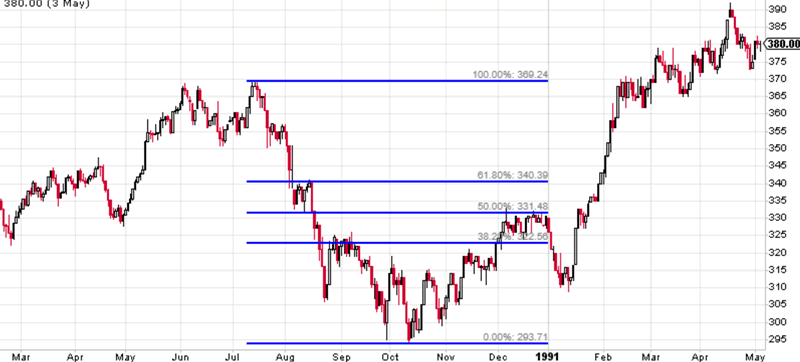
1981 (past the 20% mark)
The S&P fell 22.3% before making a small retracement that almost reached 38.2%
The total size of the decline was 27.2%
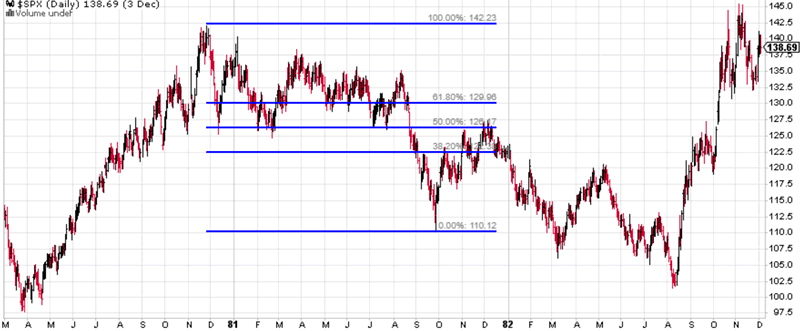
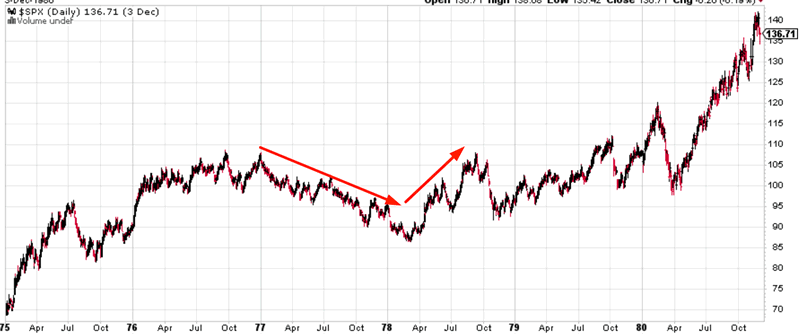
1977 (past the 20% mark)
The S&P fell 20.3% before making a big retracement that almost made new highs
The total size of the decline was 20.3%
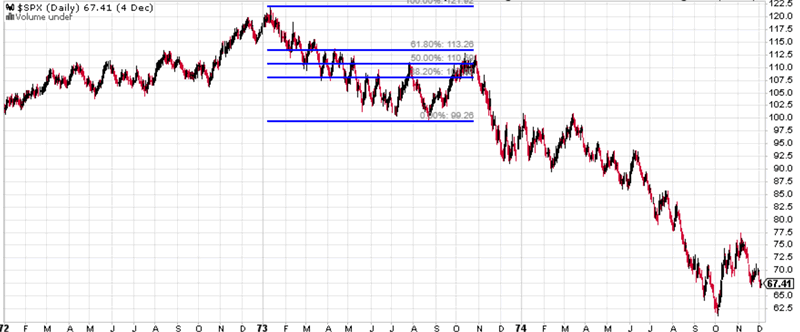
1973 (past the 20% mark)
The S&P fell 18% before making a 50% retracement
The total size of the decline was 49.9%
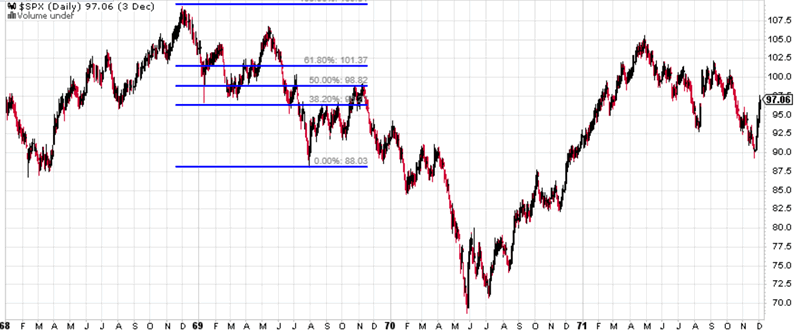
1969 (past the 20% mark)
The S&P fell 19.5% before making a 50% retracement
The total size of the decline was 37.2%
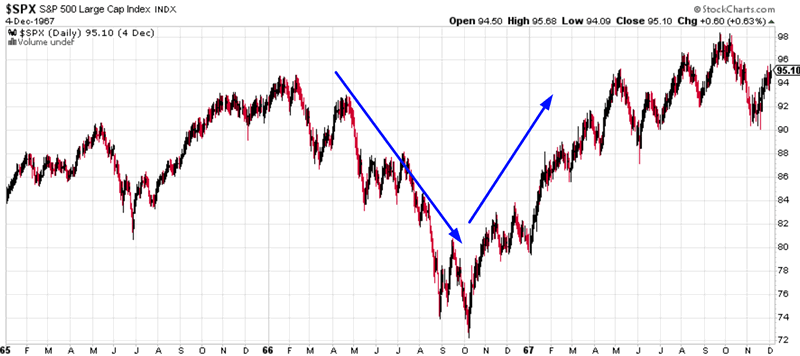
1965 (past the 20% mark)
The S&P fell 23.6% before rallying straight to new all-time highs
The total size of the decline was 23.6%
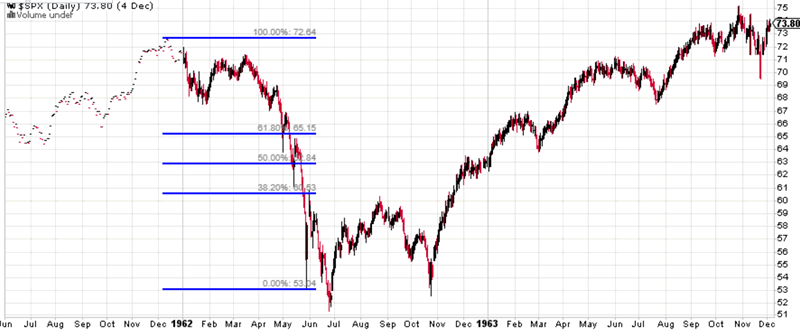
1962 (past the 20% mark)
The S&P fell 26.8% before rallying straight to new all-time highs
The total size of the decline was 29.2%
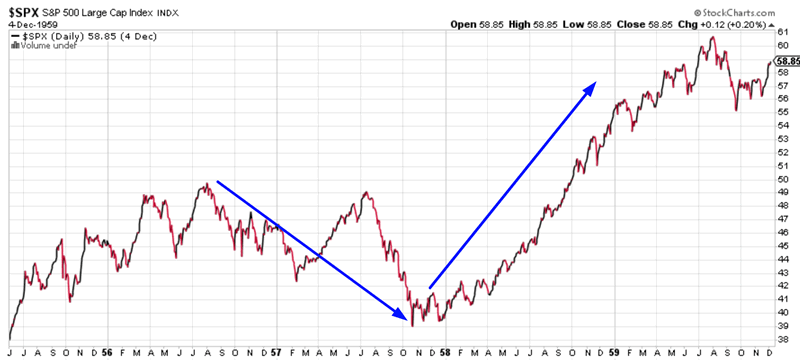
1956 (past the 20% mark)
The S&P fell 21.1% before rallying straight to new all-time highs
The total size of the decline was 21.1%
Conclusion: how much did the S&P fall before the first big rally began (regardless of whether that rally led to new highs or not)?
- 19-25%: 10 cases
- 25-30%: 2 cases
- 30-35%: 0 cases
- 35-40%: 1 case (1987)
As you can see, most cases cluster around 19-25%, with the big exception at 35% (October 1987).
Our trading plan
Emerging markets
One of the most interesting things about the U.S. stock market’s decline is how much emerging markets have outperformed while the U.S. stock market tanked. (Earlier this year, emerging markets tanked while U.S. stocks rallied).
Some analysts that I follow see this as a sign of “positive divergence”. Are they right?
Here’s what happened next to the S&P 500 when the S&P fell more than -19% over the past 3 months while EEM (emerging markets ETF) fell less than -10%.
*Data from 1996 – present
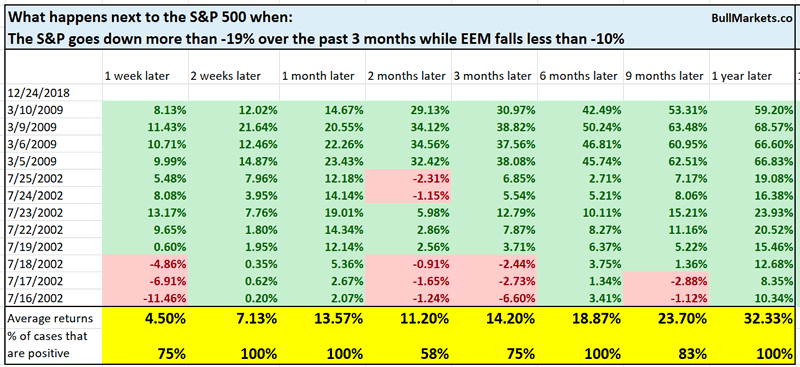
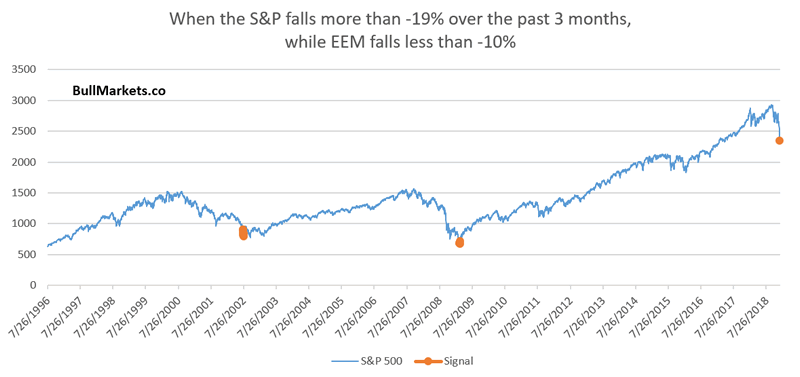
The sample size is small, but this seems to happen towards the end of bear markets.
Dr Copper
Another interesting point to note is how much copper has outperformed the S&P 500 during the recent crash.
I generally don’t like to use commodities to predict stocks, but this one makes some sense. (Copper is frequently seen as a real-time economic indicator because it is used in buildings, infrastructure, etc).
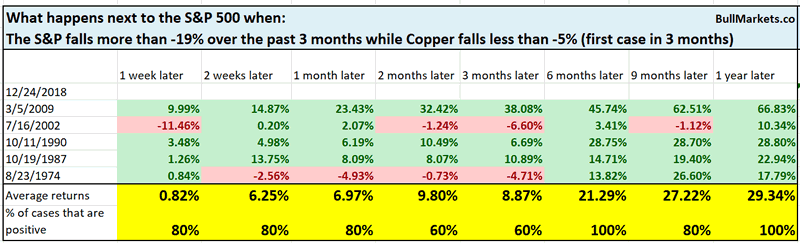
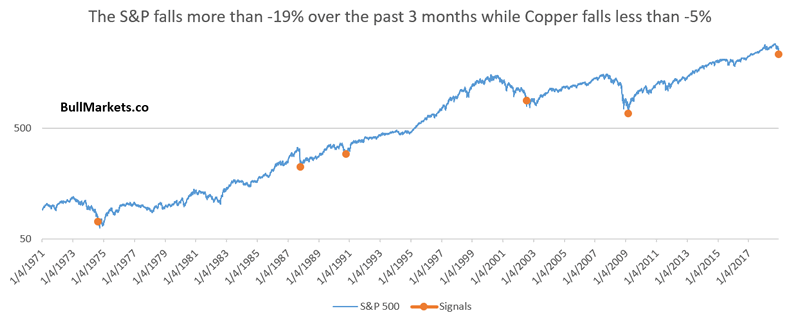
Over the past 3 months, the S&P has fallen more than -19% while copper has fallen less than -5%.
From 1971 – present, this came close to marking the bottom of a lot of bear markets.
Big 1 day Rally
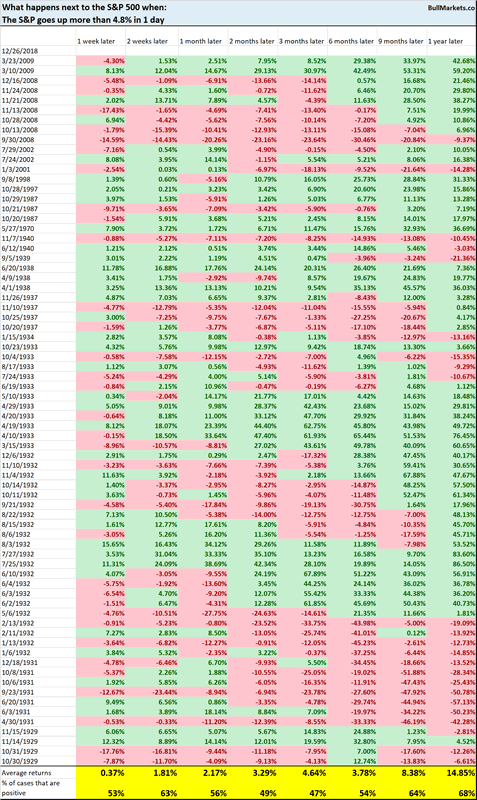
Here’s every single case in which the S&P rallied more than 4.8% in 1 day (i.e. today).
This happens quite often in bear markets (bear markets are characterized by the largest up and down movements). This is neither consistently bullish nor bearish: sometimes it happens in the middle of bear markets, sometimes it happens at the end of bear markets.
Backwardation
VIX
Bullish Percentage Index
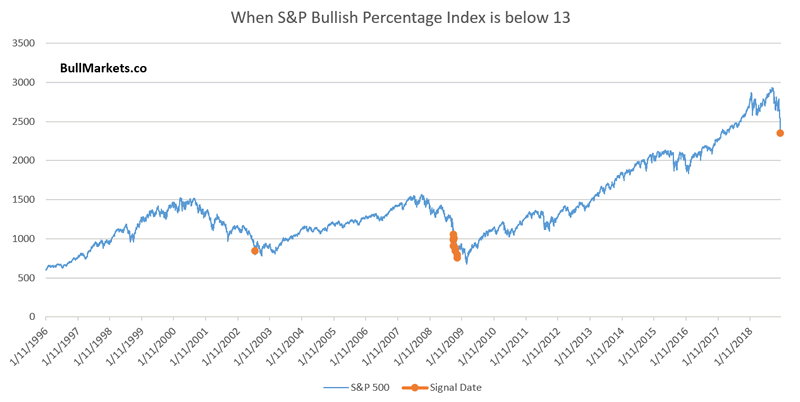
As of December 24, the S&P 500’s Bullish Percentage Index (a breadth indicator) was extremely low. The only other times it was this low were in October 2008 and July 2002.
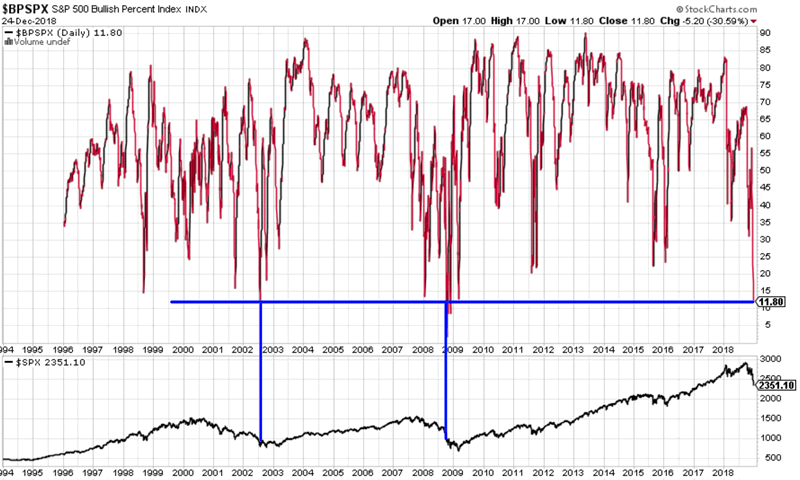
Here’s what happened next to the S&P 500 when the Bullish Percentage Index fell below 13
*Data from 1996 – present
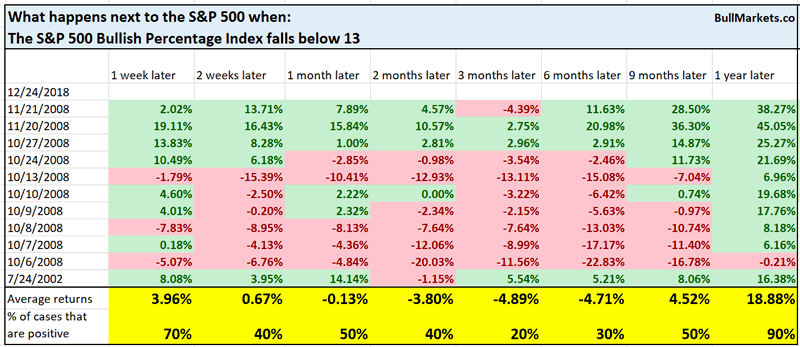
As you can see, while stocks could fall more in the short term, this was generally a medium term bullish sign.
*I think a 2008-style 50% crash right now is an exxageration. The financial system was imploding in 2008 and the U.S. economy was in a massive recession. The context is very different from today.
Breadth
Other breadth indicators continue to demonstrate extremes. Only 1.2% of S&P 500 stocks are above their 50 dma right now.
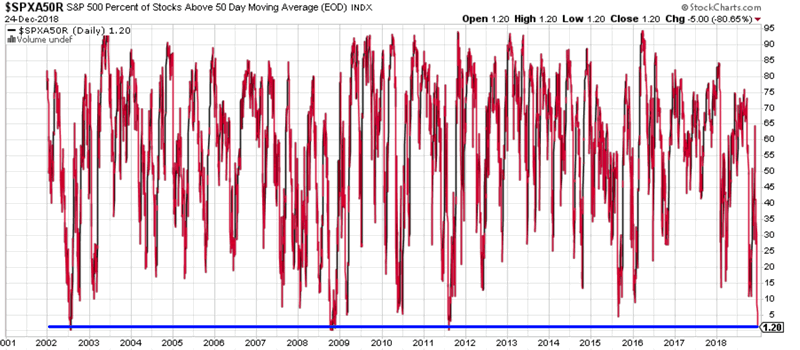
Here’s what happened next to the S&P when less than 2% of its stocks were above their 50 dma.
*Data from 2001 – present
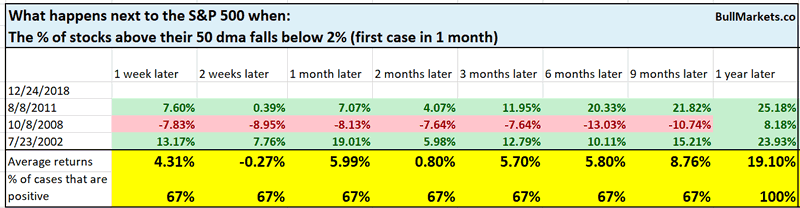
As you can see, while stocks could fall more in the short term, this was generally a medium term bullish sign.
*Part of me wonders if breadth indicators are less useful than they used to be. Thanks to the rising popularity of ETFs, breadth extremes are easier and easier to reach. E.g. when someone sells $SPY, that puts downwards pressure on all 500 stocks in the S&P.
4 days in a row
As of December 24, the S&P 500 was now down 4 days in a row, with each of those 4 days down at least -1.5%
Quite the panic selling.
Here’s what happened next to the S&P when it fell more than -1.5% for 4 days in a row (first case in 1 week).
*Data from 1927 – present
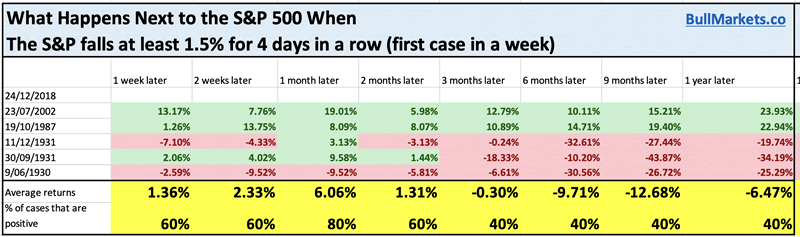
Interestingly enough, even in the Great Depression this led to a 1 month rally. Outside the Great Depression, this was close the short term and medium term bottom.
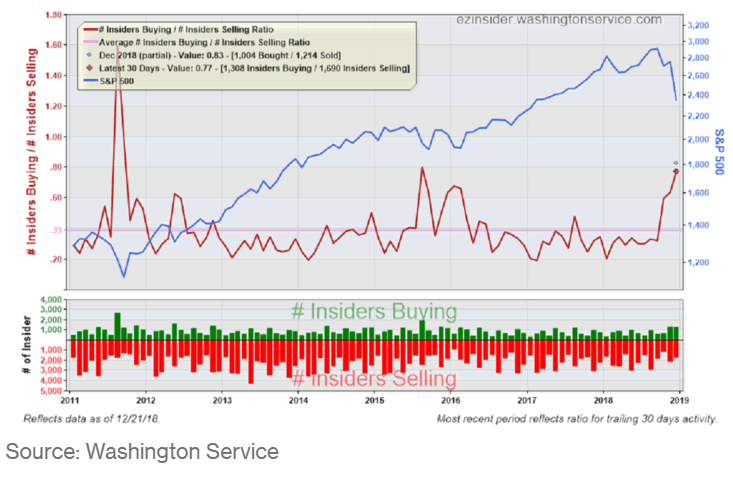
Corporate Insider Buying
The Corporate Insider Buy/Sell Ratio is now at its highest level since August 2011. (The S&P made a 20% decline in August 2011).
Click here for yesterday’s market studies
Conclusion
Here is our discretionary market outlook:
- For the first time since 2009, the U.S. stock market’s long term risk:reward is no longer bullish. This doesn’t necessarily mean that the bull market is over. We’re merely talking about long term risk:reward.
- The medium term direction is still bullish (i.e. trend for the next 6 months). However, if this is the start of a bear market, bear market rallies typically last 3 months. They are shorter in duration. Bear market rallies are choppy and fierce.
- The short term is a 50/50 bet
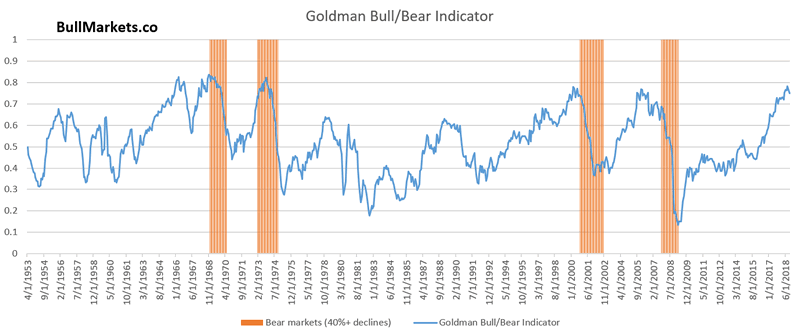
Goldman Sachs’ Bull/Bear Indicator demonstrates that while the bull market’s top isn’t necessarily in, risk:reward does favor long term bears.
Our discretionary outlook is not a reflection of how we’re trading the markets right now. We trade based on our quantitative trading models, such as the Medium-Long Term Model.
Members can see exactly how we’re trading the U.S. stock market right now based on our trading models.
Click here for more market studies
By Troy Bombardia
I’m Troy Bombardia, the author behind BullMarkets.co. I used to run a hedge fund, but closed it due to a major health scare. I am now enjoying life and simply investing/trading my own account. I focus on long term performance and ignore short term performance.
Copyright 2018 © Troy Bombardia - All Rights Reserved
Disclaimer: The above is a matter of opinion provided for general information purposes only and is not intended as investment advice. Information and analysis above are derived from sources and utilising methods believed to be reliable, but we cannot accept responsibility for any losses you may incur as a result of this analysis. Individuals should consult with their personal financial advisors.
© 2005-2022 http://www.MarketOracle.co.uk - The Market Oracle is a FREE Daily Financial Markets Analysis & Forecasting online publication.