


Safe Havens are Surging. What this Means for Stocks 2019
Stock-Markets / Stock Markets 2019 Jan 04, 2019 - 03:50 PM GMTBy: Troy_Bombardia

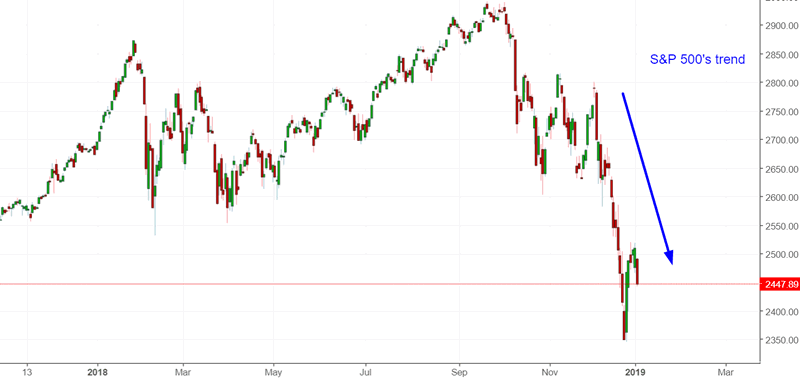
While the U.S. stock market has been trending downwards from December 2018 – present, safe havens (e.g. gold and Yen) have been going up.
Go here to understand our fundamentals-driven long term outlook.
Let’s determine the stock market’s most probable medium term direction by objectively quantifying technical analysis. For reference, here’s the random probability of the U.S. stock market going up on any given day.

*Probability ≠ certainty. Past performance ≠ future performance. But if you don’t use the past as a guide, you are blindly “guessing” the future.
Safe haven
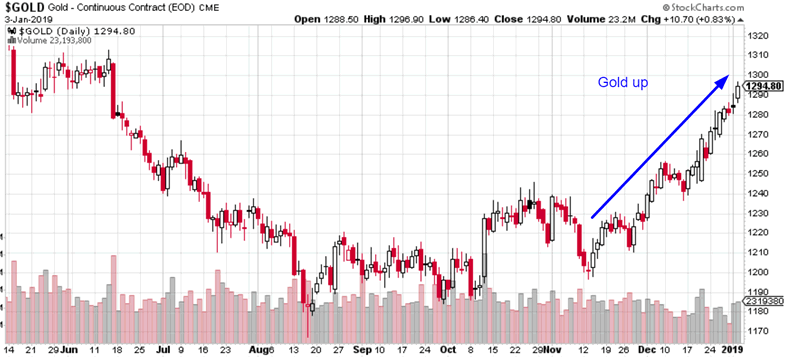
While the U.S. stock market has gone down, gold has gone up. Some veteran investors and traders see this as a repeat of early-2008, in which stocks fell while gold went up.
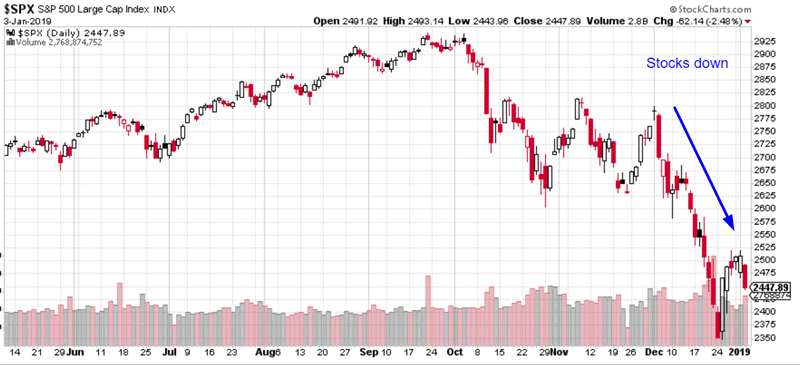
Is this a bearish sign for the U.S. stock market?
Here’s what happened next to the S&P 500 when gold went up more than 7% in the past 3 months while the S&P fell more than -15%
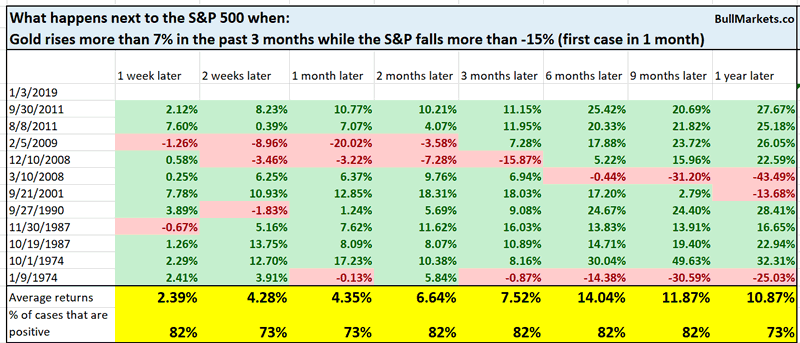
As you can see, this is not a consistently bearish factor for U.S. stocks on any time frame.
Macro Context
What about for gold? Historically:
- Gold can go up during the initial stock market crash because gold makes a “safe haven” play.
- But gold falls during the middle part of the stock market’s bear market (e.g. after March 2008, when gold fell).
Here’s what happened next to gold when gold went up more than 7% in the past 3 months while the S&P fell more than -15%
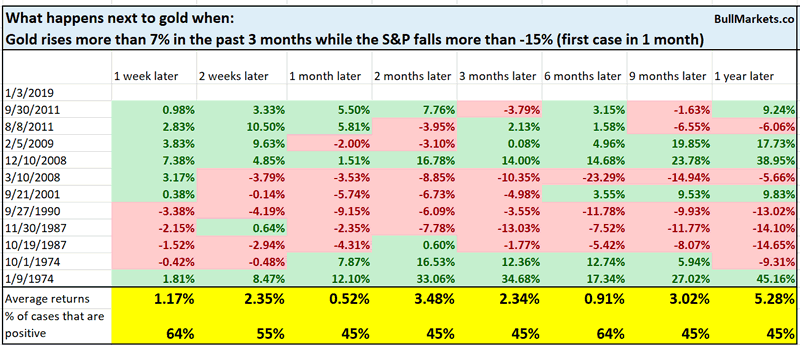
You can see how gold’s safe haven play doesn’t usually last for a long time.
Macro Context
Another safe haven
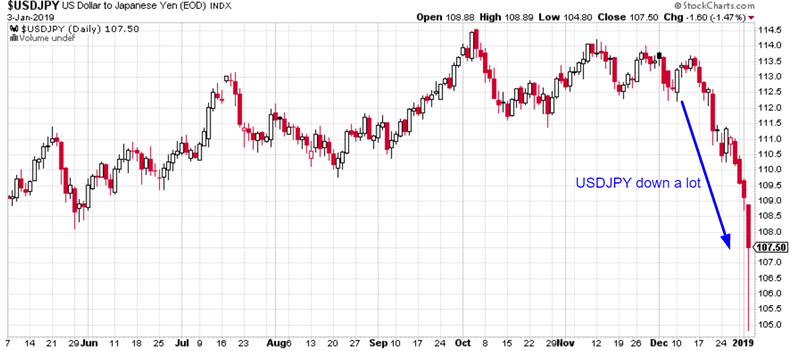
The Japanese Yen is often a “safe haven” during times of trouble. (Yen going up = USDJPY going down). There are many reasons for this phenomenon, but that topic is for another day.
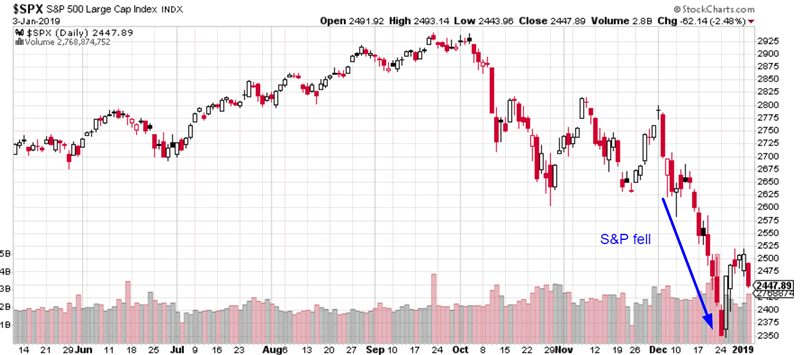
Over the past month, the S&P has tanked while the Yen surged (USDJPY tanked).
Here’s every case in which the S&P fell more than -12% over the past month while the USDJPY fell more than 5%.
*Data from 1980 – present
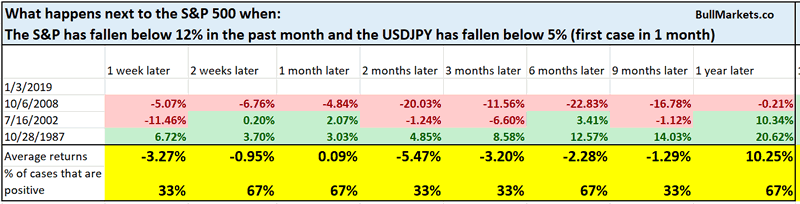
Interestingly enough, all 3 historical cases happened within the context of a 30%+ stock market decline.
Volume
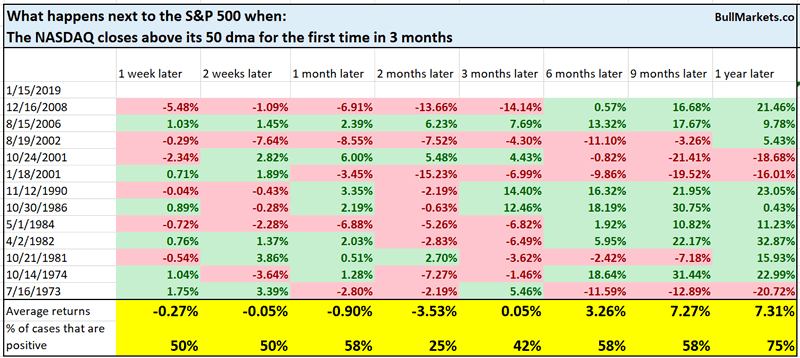
While looking for potential bullish signs for the U.S. stock market, I stumbled across the following chart.
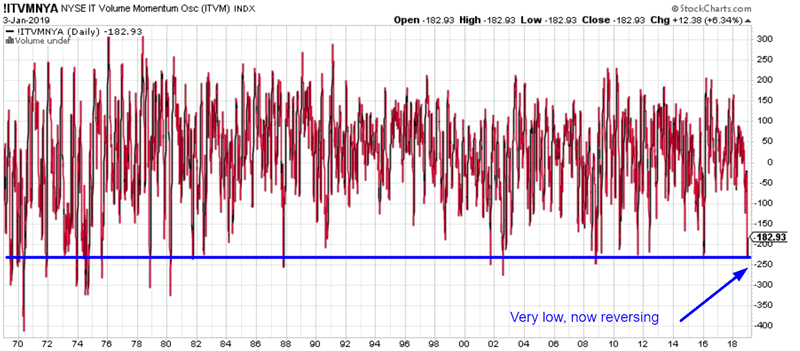
The NYSE Volume Momentum Oscillator looks at how oversold the market’s volume (and breadth) is.
It is bouncing back from extremely oversold levels.
Is this a bullish sign for the stock market?
Here’s what happened next to the S&P 500 when the NYSE Volume Momentum Oscillator reversed from under -230 to above -190
*Data from 1970 – present
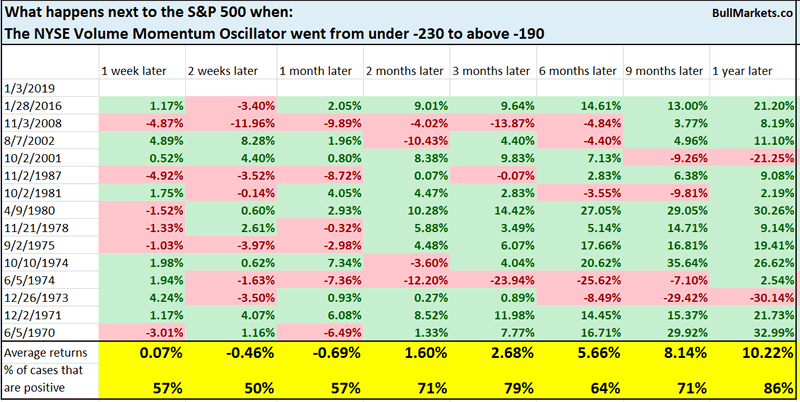
There is a slight bullish lean 1 year later, but the short term (next few weeks) tends to be choppy.
Macro Context
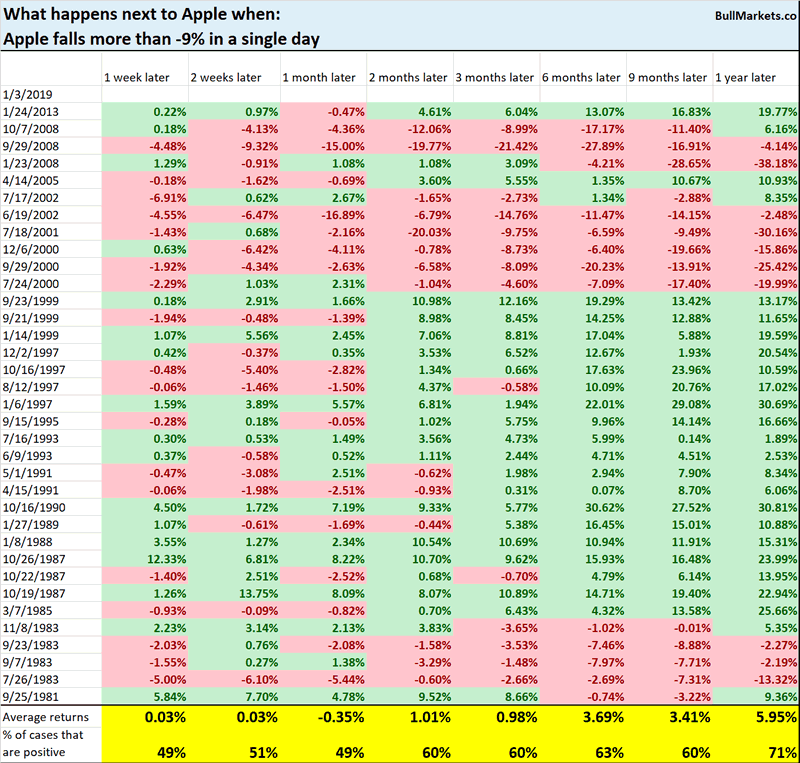
Apple
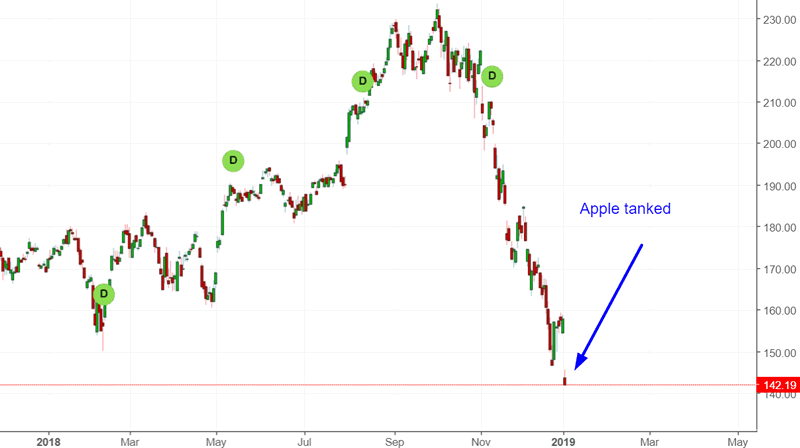
Apple tanked more than -9% today.
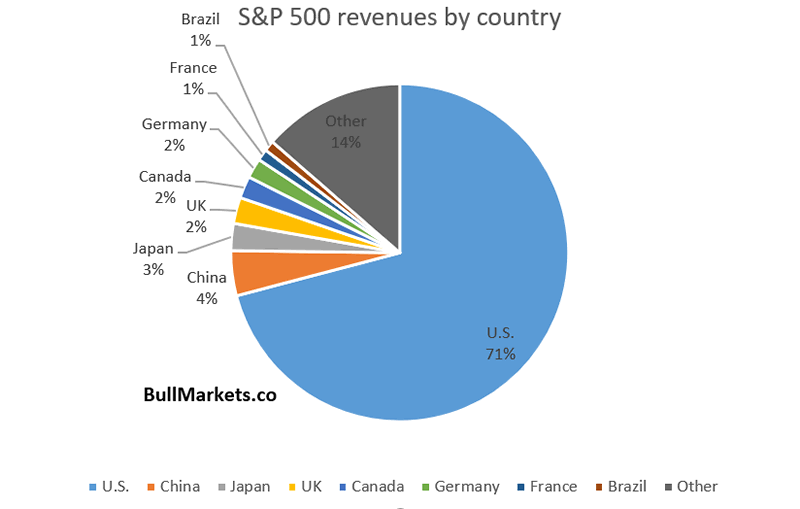
The story promoted by mainstream financial media is that this represents “a slowdown in the Chinese economy”. Personally, I disagree. I think Apple’s weakness in Chinese sales has more to do with domestic competition (Chinese smartphone companies) and a mature, stagnant product.
When things go south, people like to find a scapegoat. In some cases, the scapegoat is “China”. Here’s the reality. Only about 5% of the S&P 500’s revenues actually come from China.
Here’s every single day in Apple’s history in which its stock fell more than -9% in 1 day. As you can see, neither bulls nor bears have an edge. So just because Apple fell a lot, doesn’t necessarily mean that it will go up.
Macro Context
Yield curve
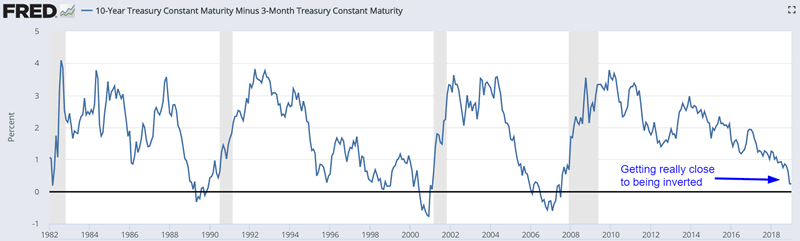
The entire yield curve is now almost inverted.
I’d like to note that the all-important 10 year – 3 month yield curve is very close to being inverted. It currently stands at just 0.15%
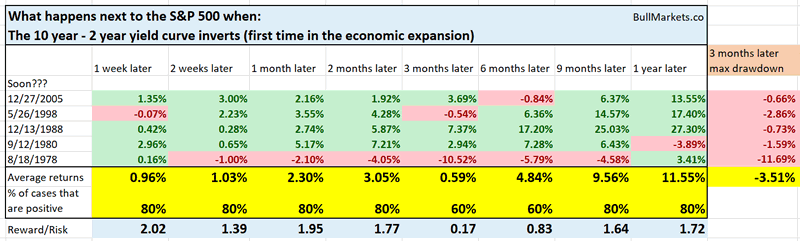
Here’s what happened next to the S&P when the 10 year – 2 year yield curve inverts.
Here’s what happened next to the S&P when the 10 year – 3 month yield curve inverts.

You can see that the stock market tends to do well after the 10 year – 2 year yield curve inverts, but the stock market tends to perform poorly after the 10 year – 3 month yield curve inverts.
Why the difference?
In most cases, the 10 year – 2 year yield curve inverts long before the 10 year – 3 month yield curve. But in today’s case, both yield curves are going to invert at around the same time.
So count this as one of the big long term warning signs in 2019.
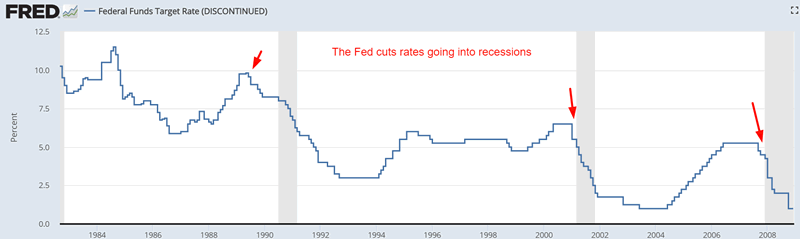
And lastly, some financial commentators are talking about how the stock market will rally if the Fed cuts rates this year.
In reality, investors should watch out for the first rate cut after the last rate hike in each economic expansion.
- September 18, 2007
- January 3, 2001
- June 6, 1989
Here’s what the S&P 500 did next in each of those cases
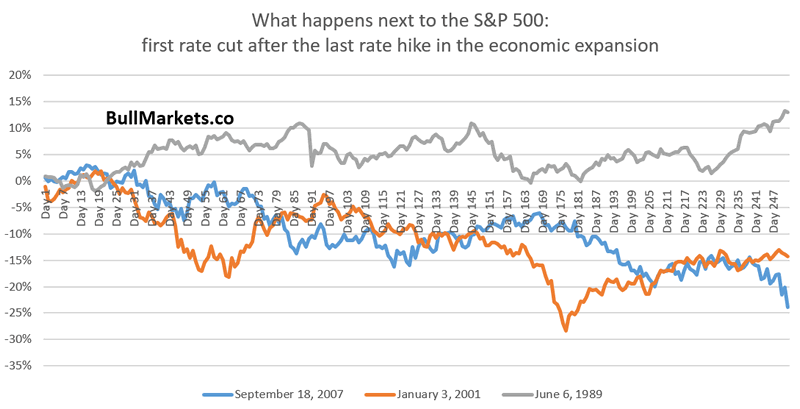
So why does the stock market tends to perform poorly AFTER the Fed cuts rates? Because the Fed is reactive. It reacts to economic data. The Fed cuts rates because the economy is deteriorating. Significant economic deterioration = long term bearish for the stock market.
This will be a long term bearish sign if the Fed starts to cut rates in the second half of 2019.
Click here for yesterday’s market study
Conclusion
Here is our discretionary market outlook:
- The U.S. stock market’s long term risk:reward is no longer bullish. This doesn’t necessarily mean that the bull market is over. We’re merely talking about long term risk:reward. Long term risk:reward is more important than trying to predict exact tops and bottoms.
- The medium term direction is still bullish (i.e. trend for the next 6 months). However, if this is the start of a bear market, bear market rallies typically last 3 months. They are shorter in duration.
- The stock market’s short term has a slight bearish lean. Focus on the medium-long term because the short term is extremely hard to predict.
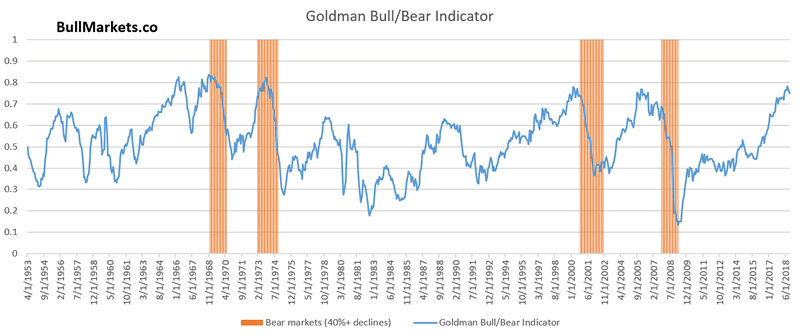
Goldman Sachs’ Bull/Bear Indicator demonstrates that while the bull market’s top isn’t necessarily in, risk:reward does favor long term bears.
Our discretionary outlook is not a reflection of how we’re trading the markets right now. We trade based on our quantitative trading models.
Members can see exactly how we’re trading the U.S. stock market right now based on our trading models.
Click here for more market studies
By Troy Bombardia
I’m Troy Bombardia, the author behind BullMarkets.co. I used to run a hedge fund, but closed it due to a major health scare. I am now enjoying life and simply investing/trading my own account. I focus on long term performance and ignore short term performance.
Copyright 2019 © Troy Bombardia - All Rights Reserved
Disclaimer: The above is a matter of opinion provided for general information purposes only and is not intended as investment advice. Information and analysis above are derived from sources and utilising methods believed to be reliable, but we cannot accept responsibility for any losses you may incur as a result of this analysis. Individuals should consult with their personal financial advisors.
© 2005-2022 http://www.MarketOracle.co.uk - The Market Oracle is a FREE Daily Financial Markets Analysis & Forecasting online publication.