


Stock Market Bull Trap? January 22 Top Likely
Stock-Markets / Stock Markets 2019 Jan 19, 2019 - 03:05 PM GMTBy: Brad_Gudgeon

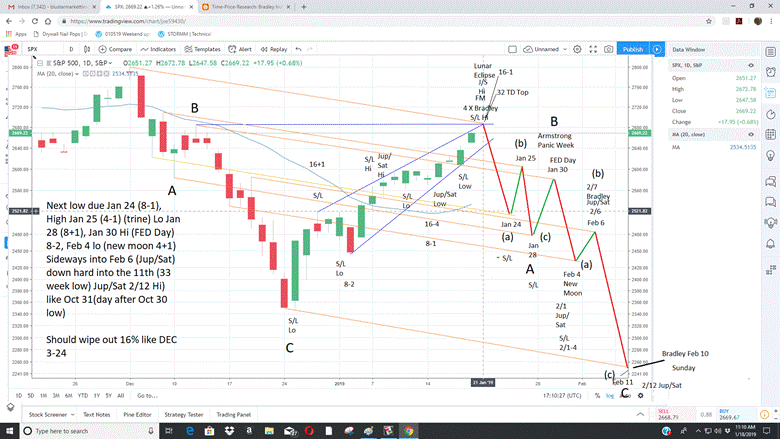
 It has been a while since I have written a public article. The current set up is just too intriguing not to write about. Therefore, let me cut to the chase. The stock market peak of October 3, 2018 and subsequent drop into Dec 26 is not over, not by any measure that I can see. In fact, a likely C wave down from January 22 (full moon/lunar eclipse in Leo, major 4 X Bradley turn due 1/18, 32 TD top plus nasty astro aspects like Mars in Aries square Saturn combined with Jupiter square Neptune 1/13,) into February 11th is about to take place.
I believe the top on Tuesday will start from a high of 2685 (the top of the rising wedge… see chart below) and drop another 16% just like we did from Dec 3 into the 26th. That targets about 2250 on the S&P 500 for the February low (February 11 is the 33 week, 32 TD and 7 week low). A double bottom will likely form into March 6th, the Gann 16 TD low.
It is interesting to note that March 6th is the Gann 10 year anniversary of the Great Recession bottom. February 11th is also the 3rd anniversary of the 2016 bottom. From March 6th into August 19, I expect a move to above 3100 on the S&P 500!! Early March to early April will likely be the biggest part of that move, IMO.
There should be a minor low in May and topping into June where we have another Jupiter square Neptune on the 16th, followed by a late July twenty week low. The August top looks like it will go down into around the 18th of October, especially after the last passage of Jupiter square Neptune on September 21st.
Thank you Trading View for providing my charting service.
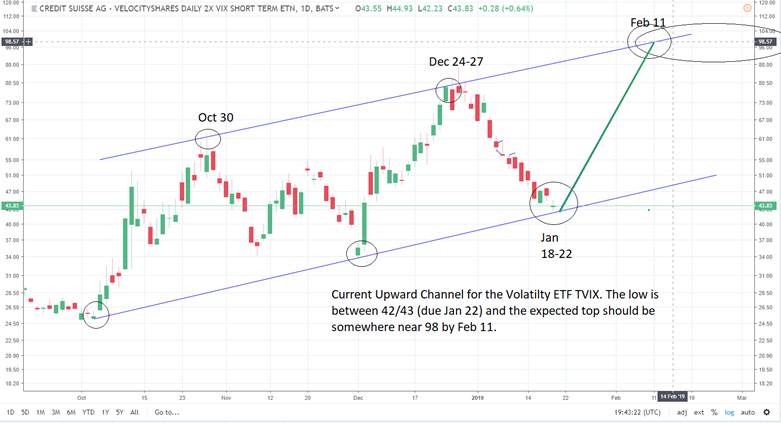
The chart below tracks TVIX the ETF proxy for the VIX. Currently at or near $42/$43, I believe we see near $98 by February 11.
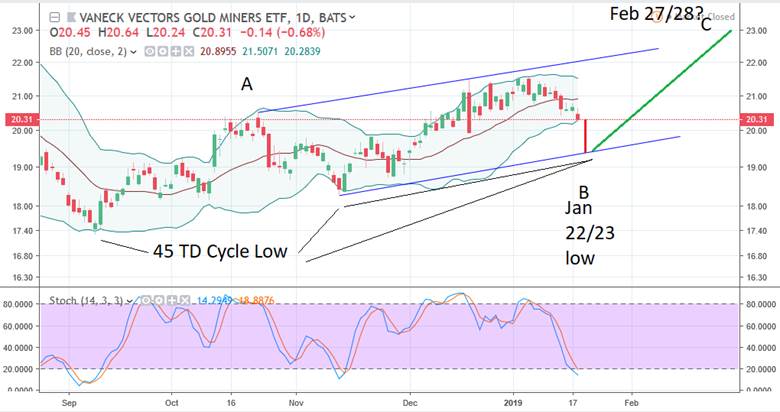
GDX is forming a 45 TD low within the next two trading days and should rally perhaps to 23 by late February. I’m not certain what will happen after that. I still believe gold, silver and the PM’s are in a long term bear since 2011 that will not end until late 2023.
My current E Wave position is that we topped out whatever wave top on Jan 26, 2018 falling into x of X April 2, 2018, rising into the October 3 top wave y of X and now z of X finishing in March of this year. This leaves a Y wave moving back up into the former rising wedge near 3100 in August followed by Z at least back down to near 2075 or lower (taking out the Trump Rally) by February/ March early next year (the 4 year cycle low from early 2016).
This whole formation looks like a broadening top formation with a final top due around May 2021 to somewhere around 3500/3775 depending on how low we go in 2020 (we could go as low as the 2016 low near 1810). I believe the next down turn after that will rival the Great Depression of 1929-32 and end sometime around early 2024.
Brad Gudgeon
Editor of The BluStar Market Timer
The BluStar Market Timer was rated #1 in the world by Timer Trac in 2014, competing with over 1600 market timers. This occurred despite what the author considered a very difficult year for him. Brad Gudgeon, editor and author of the BluStar Market Timer, is a market veteran of over 30 years. The website is www.blustarmarkettimer.info To view the details more clearly, you may visit our free chart look atwww.blustarmarkettimer.com
Copyright 2019, BluStar Market Timer. All rights reserved.
Disclaimer: The above information is not intended as investment advice. Market timers can and do make mistakes. The above analysis is believed to be reliable, but we cannot be responsible for losses should they occur as a result of using this information. This article is intended for educational purposes only. Past performance is never a guarantee of future performance.
Brad Gudgeon Archive |
© 2005-2022 http://www.MarketOracle.co.uk - The Market Oracle is a FREE Daily Financial Markets Analysis & Forecasting online publication.