


Break above $1300 in Gold Forms Elliott Wave Impulse
Commodities / Gold & Silver 2019 Jan 30, 2019 - 09:09 AM GMT

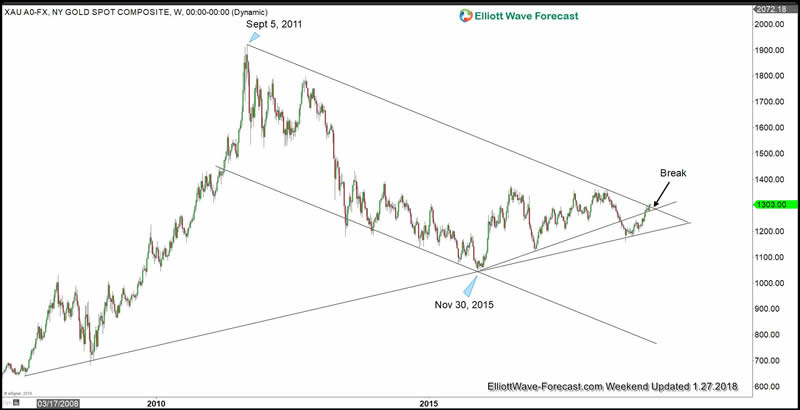
Last Friday Gold managed to break above $1300. The yellow metal has therefore broken above 8 year bearish channel in a weekly closing basis. The break also allows the metal to close back above the ascending trend support from Nov 30, 2015 low as the chart below shows.
Gold breaks above long term bearish channel
Earlier this month, we highlighted the possibility that 2019 can be a good year for Gold. We identified several technical as well as fundamental factors which could support the yellow metal. For example, even though Gold has not done much against U.S Dollar, it has broken to all-time high against many emerging market currencies. In addition, it has also made a new all-time high against Australian Dollar earlier this year. You can read the full analysis in this article : Has the next Bull Market in Gold Started?
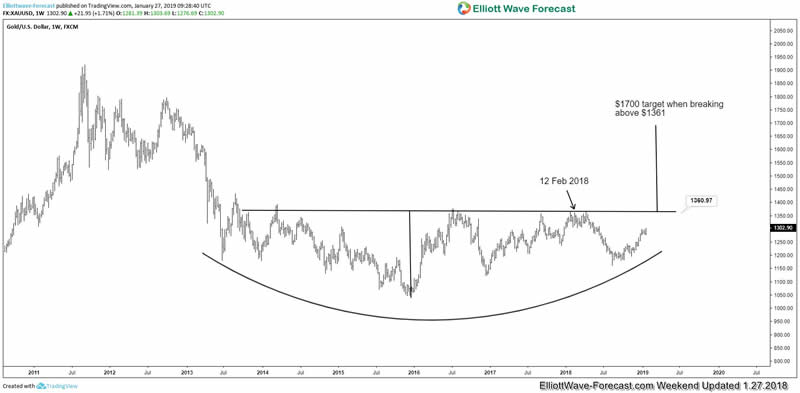
The break above $1300 last Friday likely paves the way for the yellow metal to retest last year’s peak at $1360. In our previous Elliott Wave technical video analysis, we said that if it breaks above $1300, the move from 8/16/2018 low ($1160.6) can become impulsive.
Gold Elliott Wave Technical Analysis from Jan 24, 2019

Last week, Gold still had a chance to continue consolidation as far as it stays below $1300. However, we explained in the video that the larger time frame expects a move higher eventually. We also explained the potential that the move from 8/16/2018 low ($1160.37) becomes impulsive if it breaks above $1300. That’s what we had last Friday and thus, we now expect Gold to continue higher as 1 hour weekend chart update below shows.
1 Hour Gold weekend Elliott Wave chart
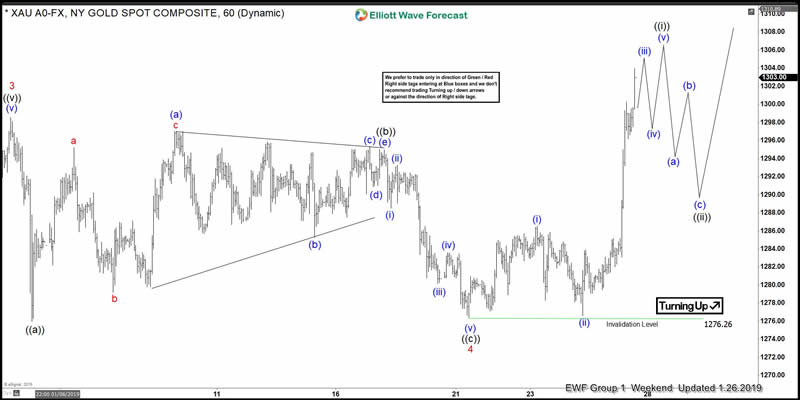
As above chart shows, the short term Elliott Wave structure in Gold now expects the metal to continue higher as far as pullback stays above 1/21/2019 low ($1276.26) in the first degree. The entire rally from 8/16/2018 low ($1160.63) thus becomes impulsive with a nest where the yellow metal now is ending wave 5 of (3).
Gold should now retest $1360 rather quickly, which is a very significant level that has been tested multiple times. A decisive break and close above the level suggests a potential move to $1700 as the next swing target.
Keep in mind that market is dynamic and the outlook may have changed since the writing time of the article. Interested to see more? You can find more Free technical analysis on commodities from this commodity blog page. If you’d like to check our service and get a regular update on Elliott Wave charts and listen to daily live session, you can do it through this 14 days FREE Trial link.
By EWFHendra
https://elliottwave-forecast.com
ElliottWave-Forecast has built its reputation on accurate technical analysis and a winning attitude. By successfully incorporating the Elliott Wave Theory with Market Correlation, Cycles, Proprietary Pivot System, we provide precise forecasts with up-to-date analysis for 52 instruments including Forex majors & crosses, Commodities and a number of Equity Indices from around the World. Our clients also have immediate access to our proprietary Actionable Trade Setups, Market Overview, 1 Hour, 4 Hour, Daily & Weekly Wave Counts. Weekend Webinar, Live Screen Sharing Sessions, Daily Technical Videos, Elliott Wave Setup .
Copyright © 2019 ElliottWave-Forecast - All Rights Reserved Disclaimer: The above is a matter of opinion provided for general information purposes only and is not intended as investment advice. Information and analysis above are derived from sources and utilising methods believed to be reliable, but we cannot accept responsibility for any losses you may incur as a result of this analysis. Individuals should consult with their personal financial advisors.
© 2005-2022 http://www.MarketOracle.co.uk - The Market Oracle is a FREE Daily Financial Markets Analysis & Forecasting online publication.