


Is the Stock Market Making a Head and Shoulders Topping Pattern?
Stock-Markets / Stock Markets 2019 Apr 16, 2019 - 05:36 AM GMTBy: Troy_Bombardia

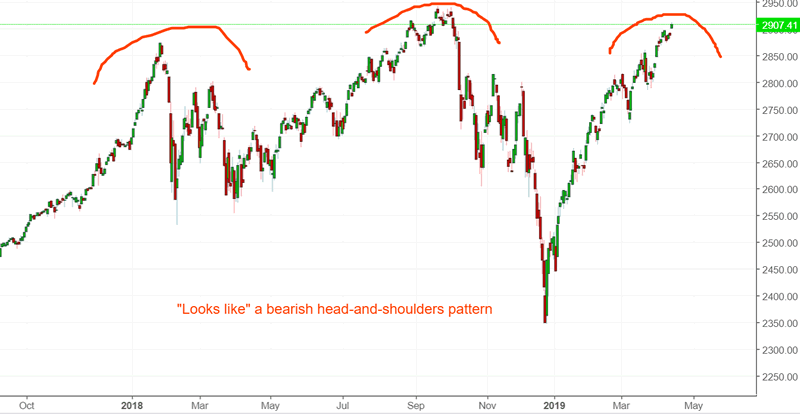
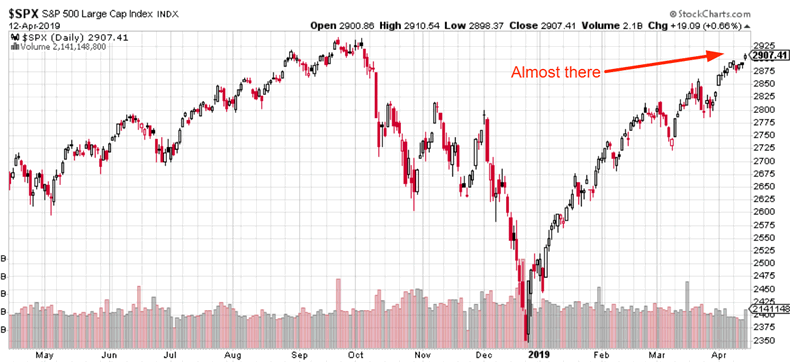
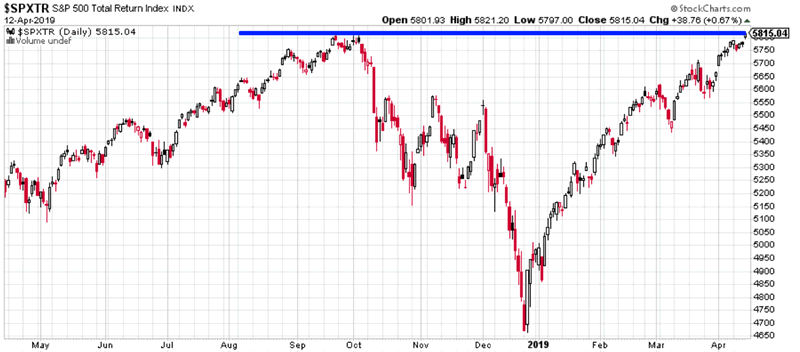
The stock market’s relentless rally continues. The S&P 500 (excluding dividends) is just 1% from a new all-time high, while the S&P 500 Total Return Index (including dividends) is already at an all-time high. While the chart may “look like” a bearish head-and-shoulders pattern, these patterns are only clear with the benefit of 20/20 hindsight. Too many potential head-and-shoulders patterns don’t work out in real-time (i.e. false bearish signals). And by the time you wait for a “bearish confirmation” break of the neckline, the S&P is already down -20%.
The economy’s fundamentals determine the stock market’s medium-long term outlook. Technicals determine the stock market’s short-medium term outlook. Here’s why:
- The stock market’s long term risk:reward is no longer bullish.
- The medium term direction (e.g. next 6-9 months) is mostly mixed, although there is a bullish lean.
- The stock market’s short term leans bearish
We focus on the long term and the medium term.
Long Term
While the bull market could keep going on, the long term risk:reward no longer favors bulls. Towards the end of a bull market, risk:reward is more important than the stock market’s most probable direction over the next 12+ months
A few leading indicators are showing signs of deterioration. The usual chain of events looks like this:
- Housing – the earliest leading indicators – starts to deteriorate. This has occurred already
- The labor market starts to deteriorate. Meanwhile, the U.S. stock market is in a long term topping process. The labor markets have not deteriorated significantly yet.
- Other economic indicators start to deteriorate. The bull market is definitely over, and a recession has started. A U.S. recession is not imminent right now
*All economic data charts are from FRED
Labor market
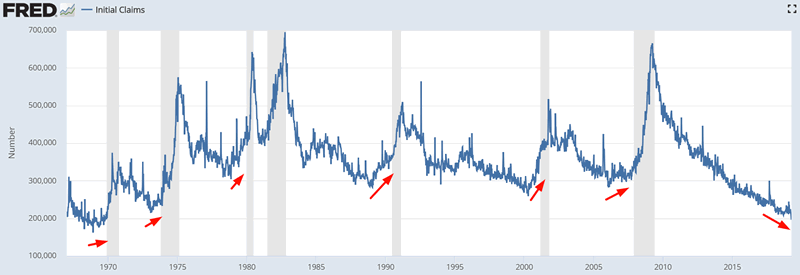
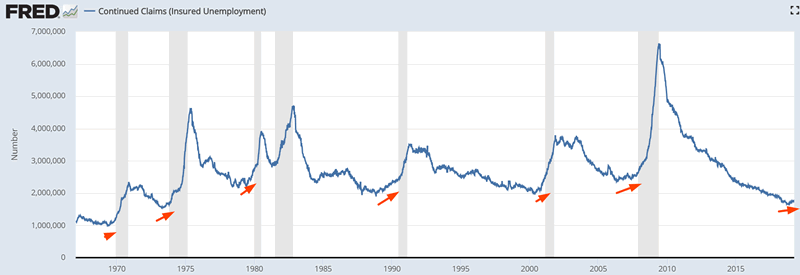
Initial Claims is trending sideways/downwards while Continued Claims is trending sideways.
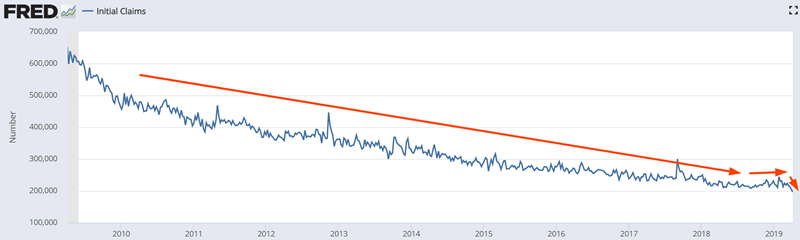
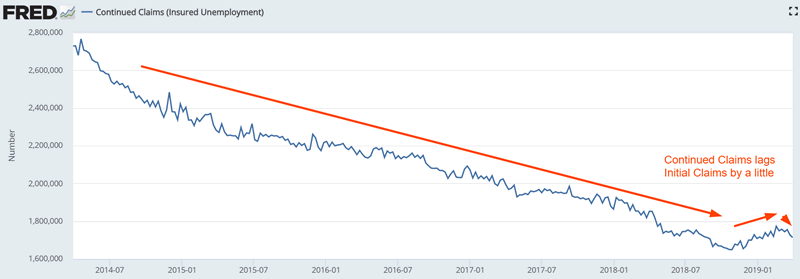
In the past, these 2 figures trended higher before bear markets and recessions began.
You don’t need to be worried about the most recent drop in Job Openings.
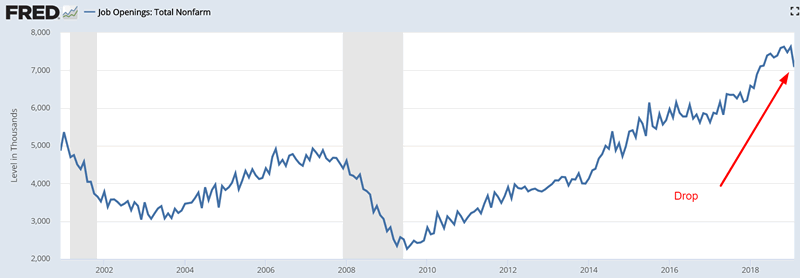
Month-to-month changes in economic data are notoriously noisy, which is why we focus on the trend.
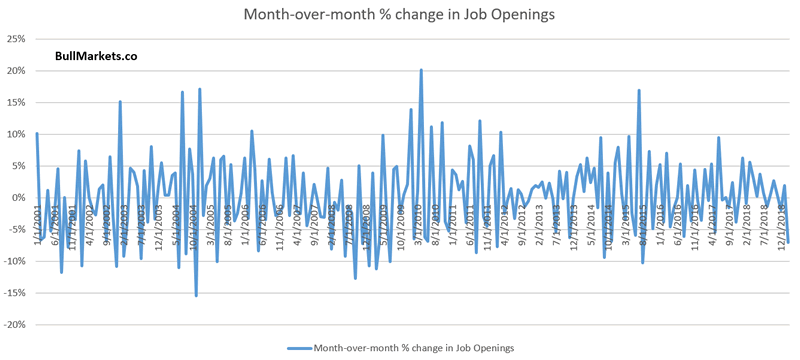
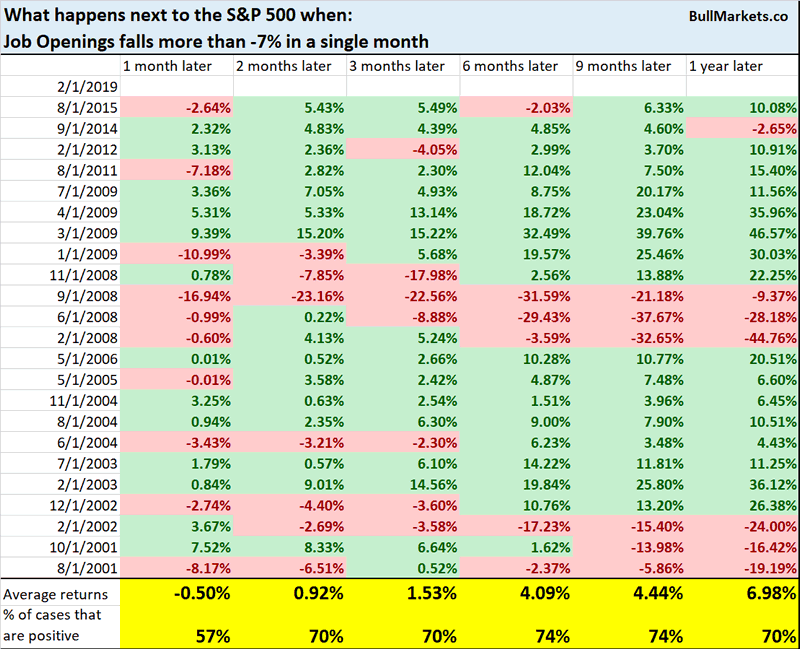
Here’s what happens next to the S&P when Job Openings falls more than -7% in a single month.
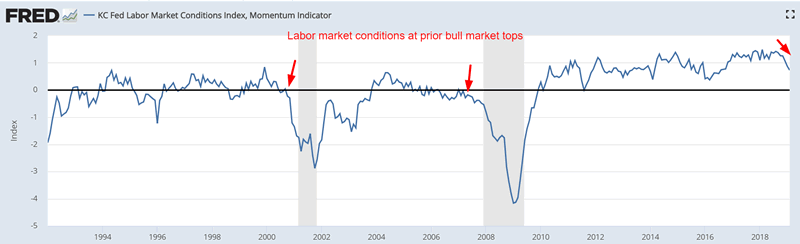
The labor markets could deteriorate in the coming months, so pay close attention to the data as it is released. For example, the KC Fed Labor Market Conditions Index is trending downwards. (This is not yet a long term bearish sign for stocks. In the past, this index fell to zero when bear markets and economic recessions began.)
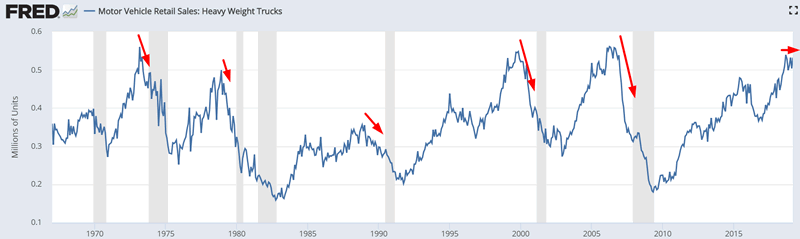
Heavy Truck Sales
Heavy Truck Sales is mostly trending sideways right now. The key point is that Heavy Truck Sales has not trended downwards. In the past, Heavy Truck Sales trended downwards before bear markets and recessions began.
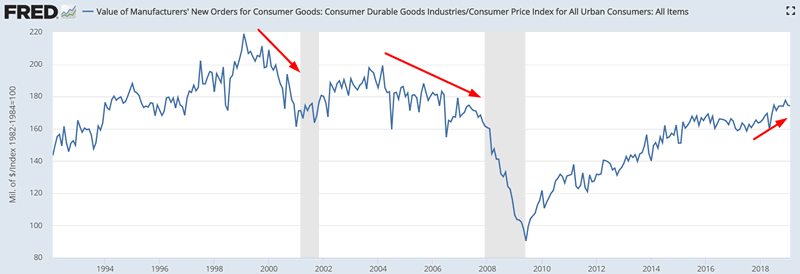
New Orders
Inflation-adjusted New Orders for Consumer Goods is still trending sideways/upwards. In the past, inflation-adjusted New Orders trended downwards before bear markets and economic recessions began.
Financial conditions
Financial conditions are still very loose. Here’s the Chicago Fed’s National Financial Conditions Index
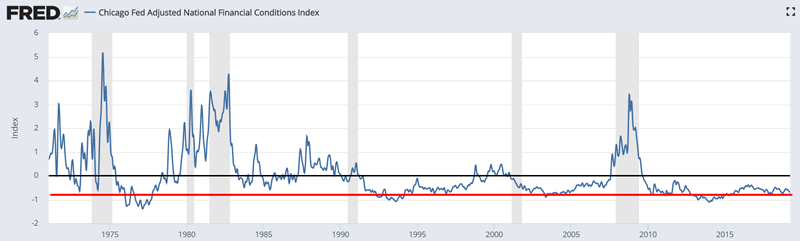
The Financial Conditions Index is broken down into 3 subindices:
- Credit
- Risk
- Leverage
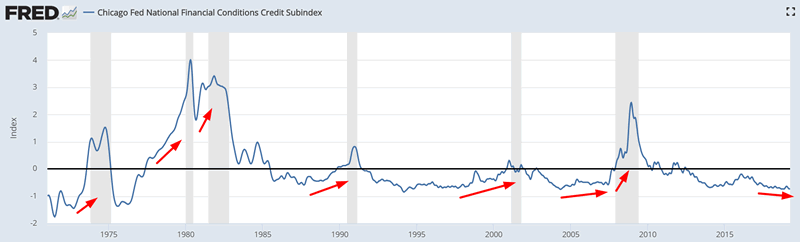
In a credit-driven economy, the Credit Subindex is most important. You can see that the Credit Subindex is still very low.
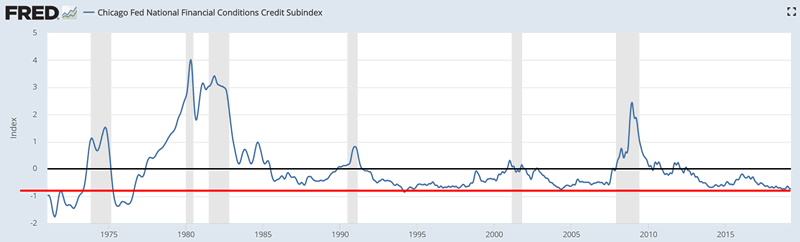
This is not a long term bearish factor for the stock market right now because historically, financial conditions tightened significantly before bear markets and recessions started.
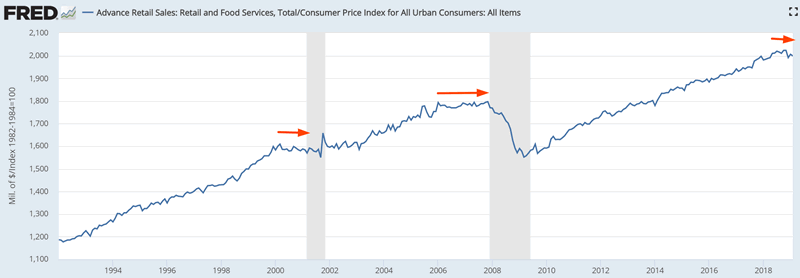
Retail Sales
Inflation-adjusted Retail Sales are no longer trending upwards. This is a necessary-but-not-sufficient condition for bear markets and economic recessions.
Valuations
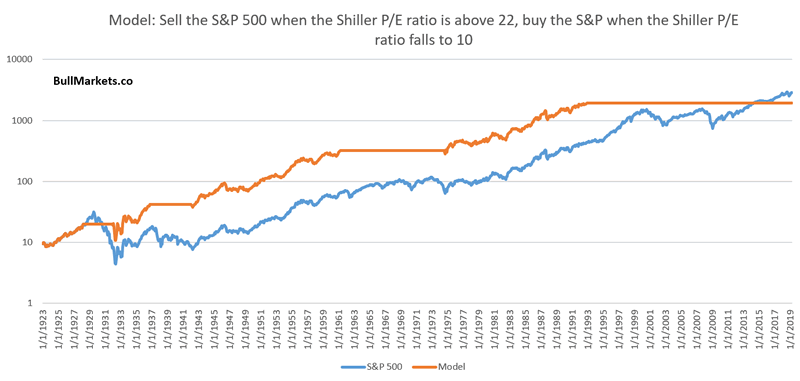
The stock market’s valuations are still extremely high, no matter what valuation indicator you use.
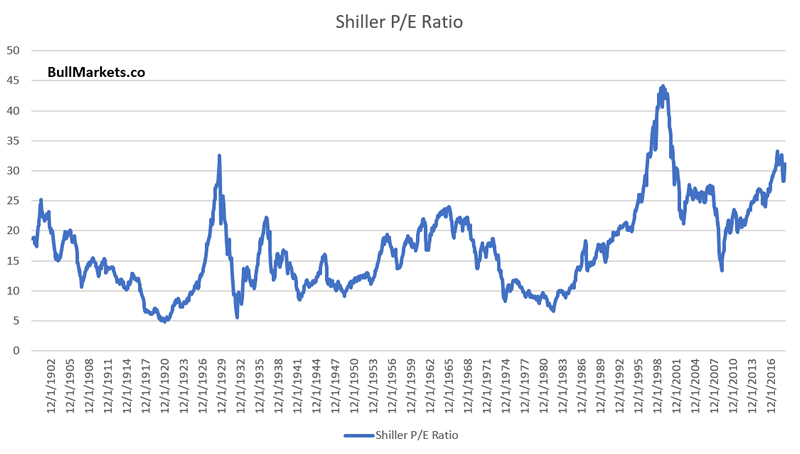
Valuations are not timing indicators. Shiller P/E consistently peaked at approximately 22 from 1900 – 1994. But from 1994 – present, valuations have been consistently higher. Here’s what happens when you sell the S&P when Shiller P/E reaches to 22. As you can see, a strategy that worked pre-1994 no longer works post-1994.
Conclusion: The stock market’s biggest long term problem right now is that as the economy reaches “as good as it gets” and stops improving, the long term risk is to the downside.
The end of a bull market is always very tricky to trade. The stock market can go up a lot in its final year, even if the macro economy is deteriorating (e.g. 2006-2007). That’s why it’s better to focus on long term risk:reward instead of trying to time exact tops and bottoms. Even when you think the top is in, the stock market could very well surge for 1 more year. (Just ask the people who thought that the dot-com bubble would end in 1998. It lasted another 1.5 years).
Medium Term
*For reference, here’s the random probability of the U.S. stock market going up on any given day, week, or month.


The stock market’s price action demonstrates a bullish lean over the next 6-12 months.
New highs
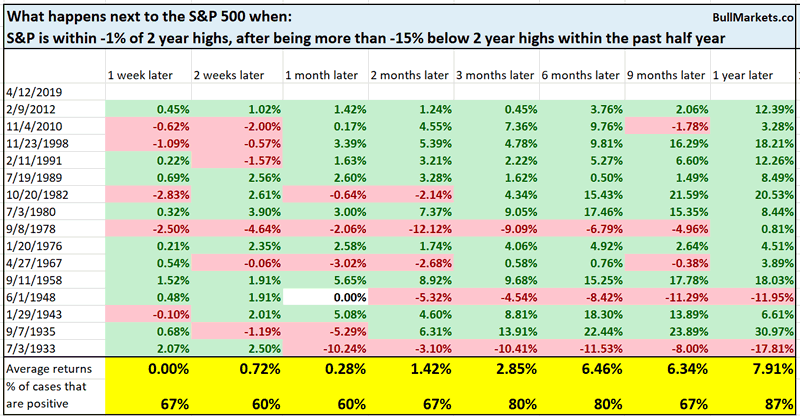
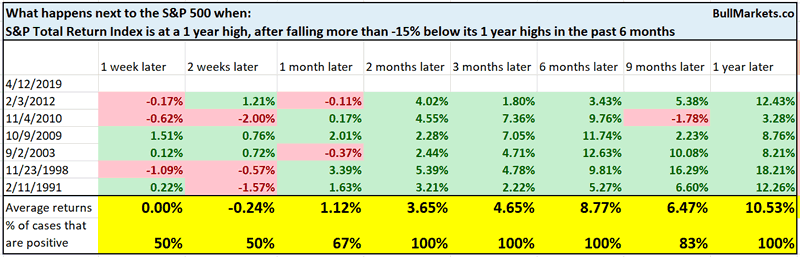
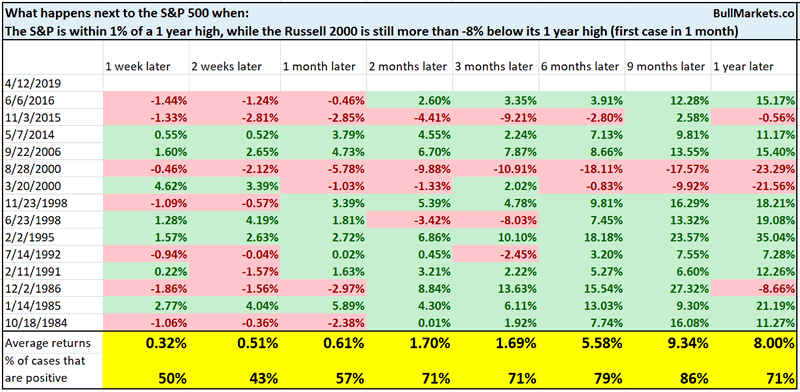
The S&P 500 is within 1% of new all-time highs while the S&P 500 Total Return Index is already at new all time highs. This is a very fast reversal, since the stock market was crashing less than 4 months ago.
Historically, such quick reversals were more bullish than bearish 3-12 months later.
Volatility
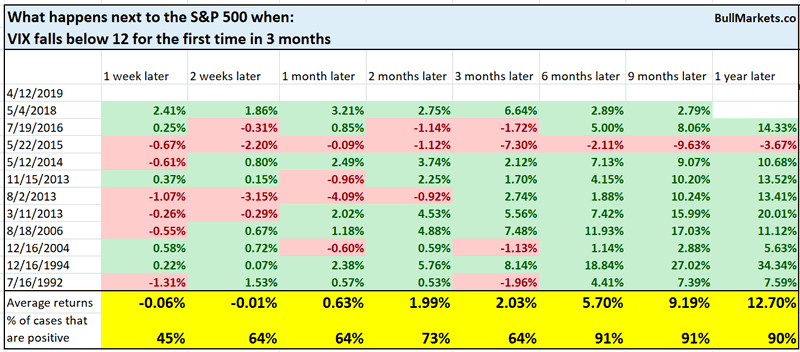
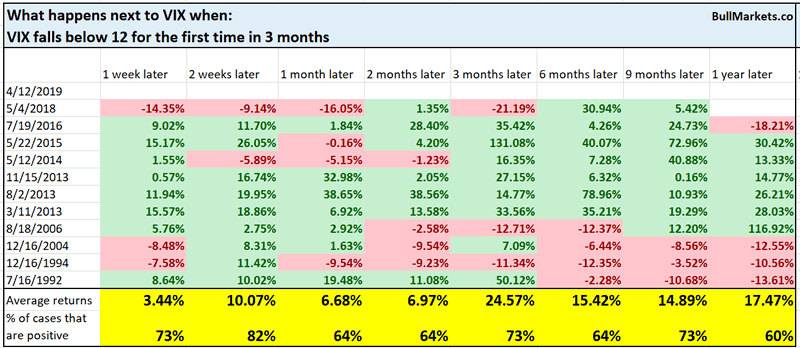
VIX fell below 12 on Friday for the first time since October 2018
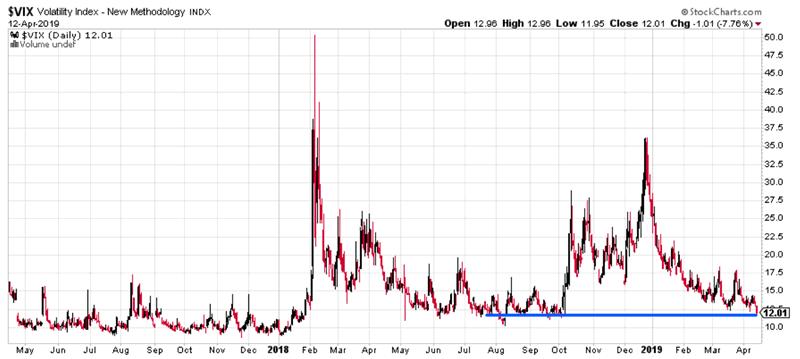
This is mostly bullish for the S&P 6-12 months later. It is also short term bullish for VIX
Trend Following + Breadth
The Zahorchak Method is an interesting indicator that combines trend following techniques with breadth/participation indicators. The general idea is that you sell when the Zahorchak indicator is breaking down (e.g. falls below -6), and buy when the indicator is breaking up (e.g. rallies above 0)
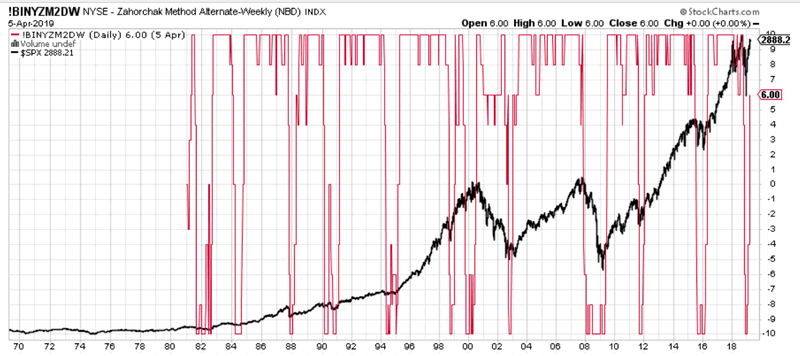
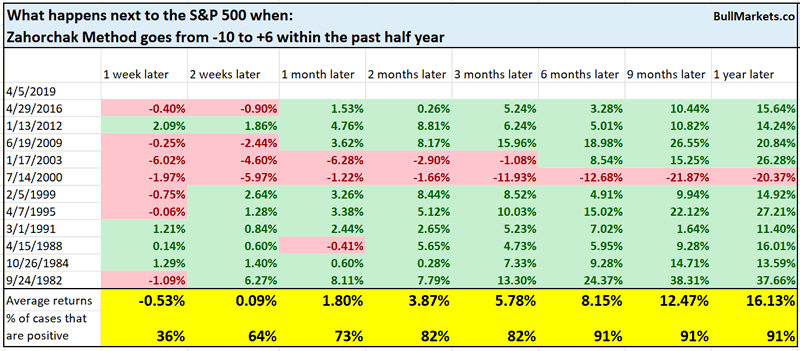
Here’s what happens next to the S&P 500 when the Zahorchak Method goes from -10 to +6 within the past 6 months.
Breadth
Breadth continues to improve as the stock market relentlessly pushes higher. Here’s the S&P 500 Bullish Percent Index, which saw weaker breadth in the 2000-2002 and 2007-2009 bear market rallies.
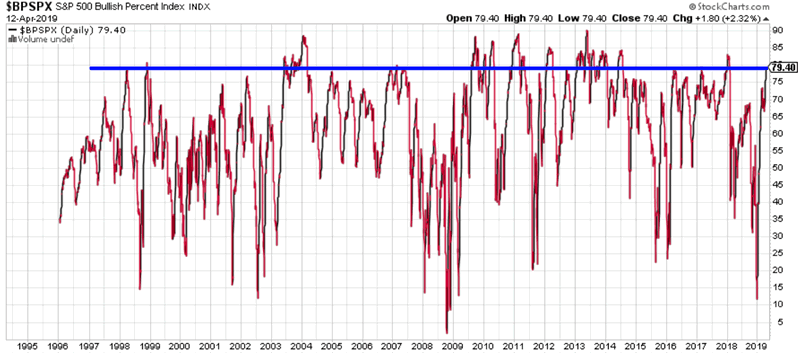
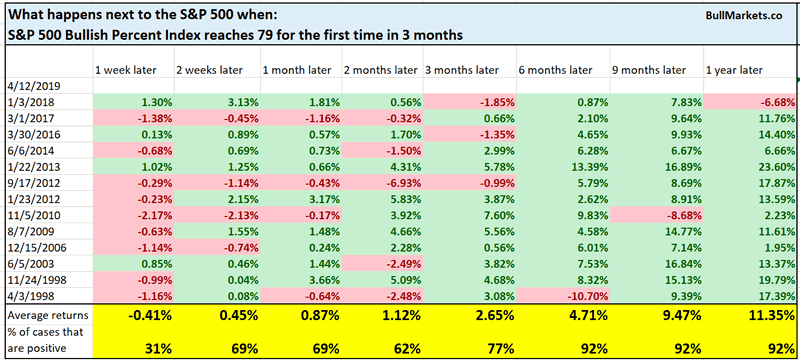
Here’s what happens next to the S&P when the Bullish Percent Index reaches 79 for the first time in 3 months.
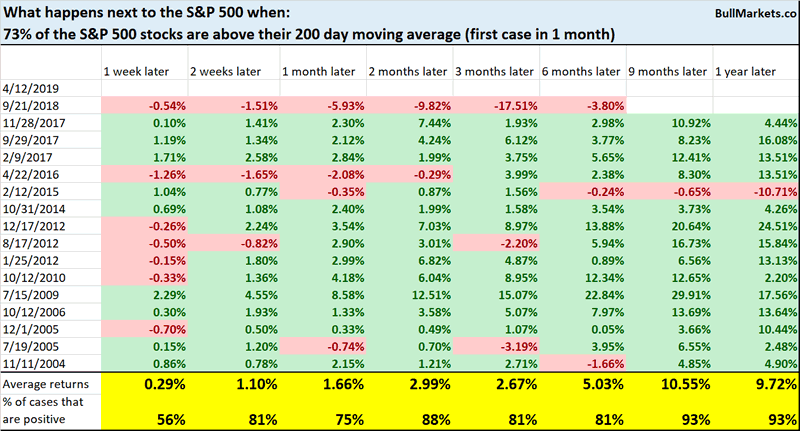
Meanwhile, 73% of the S&P 500’s stocks are above their 200 dma.
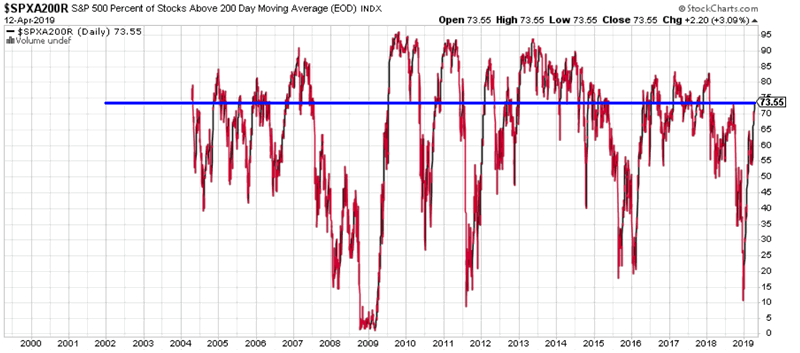
You can see that this didn’t happen during 2008’s bear market rallies.
*Be careful when using indicators with limited history. They tend to be misleading. E.g. you have no idea how this indicator performed in the 2000-2002 bear market, 1973-1974 bear market, 1969-1970 bear market.
Momentum
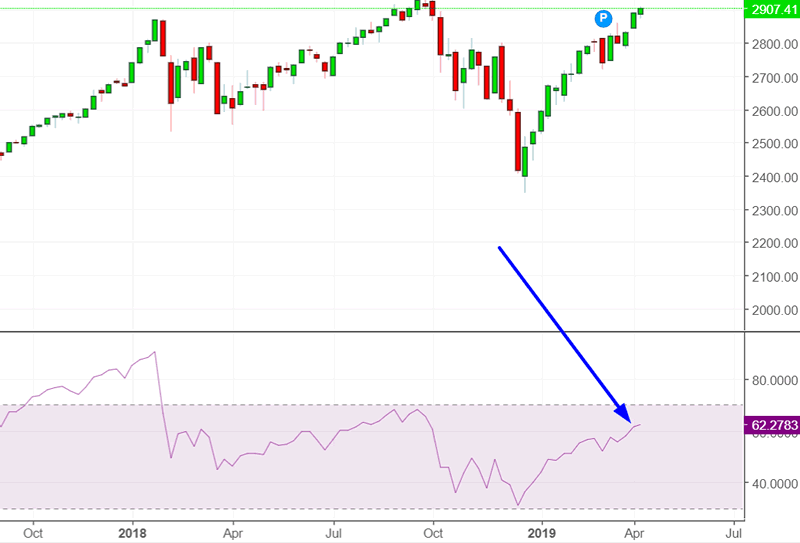
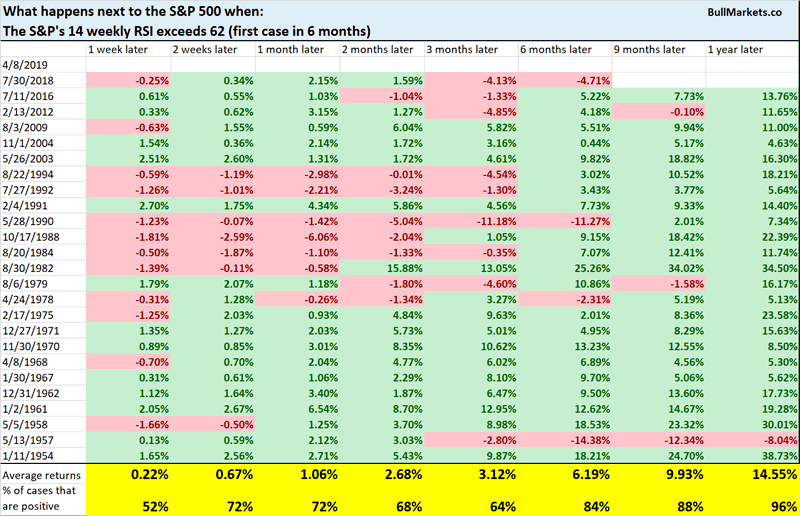
The S&P’s 14 weekly RSI (momentum indicator) is now at 62. Historical bear market rallies usually did not see such strong momentum.
Other Indices
Small caps continue to significantly lag large caps and tech.
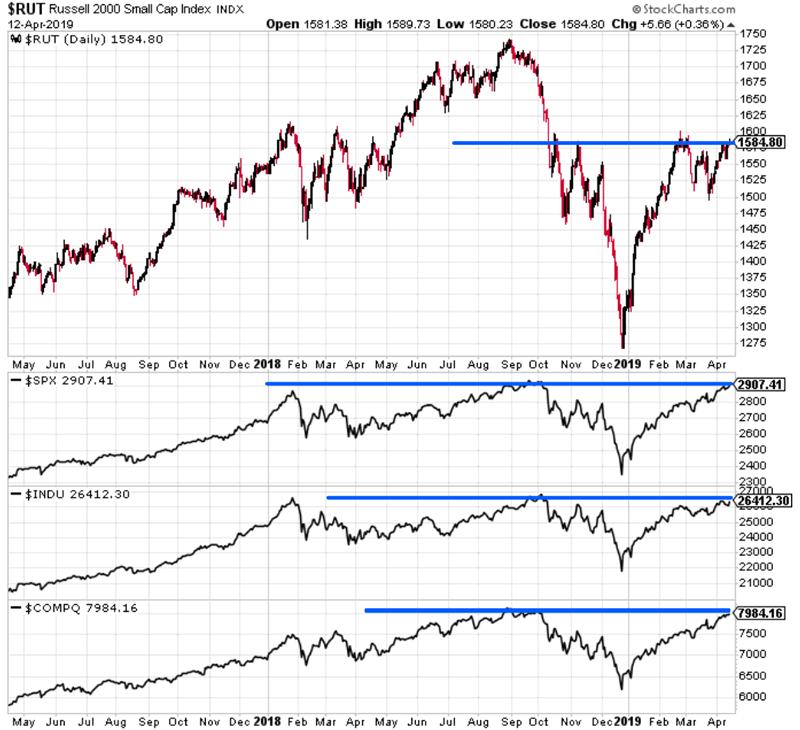
Small caps’ underperformance occurred at the top of the 2000 dot-com bubble, but also occurred in other less ominous historical cases.
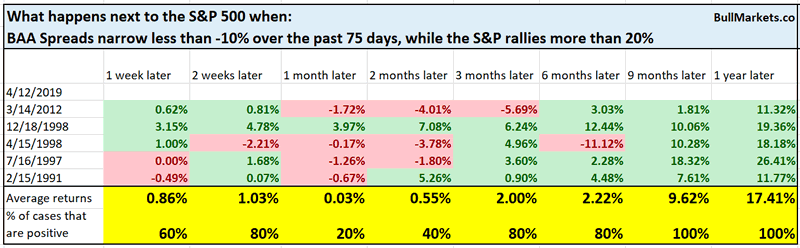
Bond Spreads
While the stock market has rallied significantly over the past 3.5 months, corporate bond spreads have not narrowed significantly.
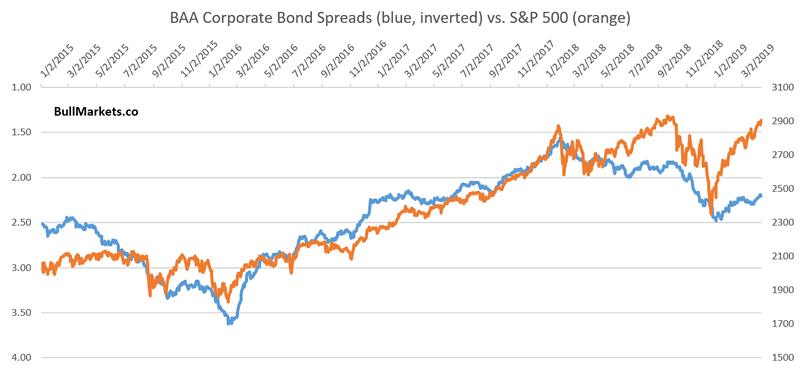
This divergence is not as long term bearish as you think.
Short Term
The stock market’s short term outlook leans bearish. However, the short term is extremely hard to predict, no matter how much conviction you think you have. That’s why we focus on the medium-long term.
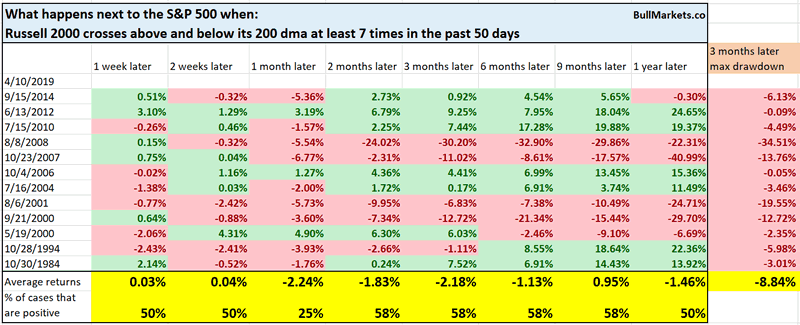
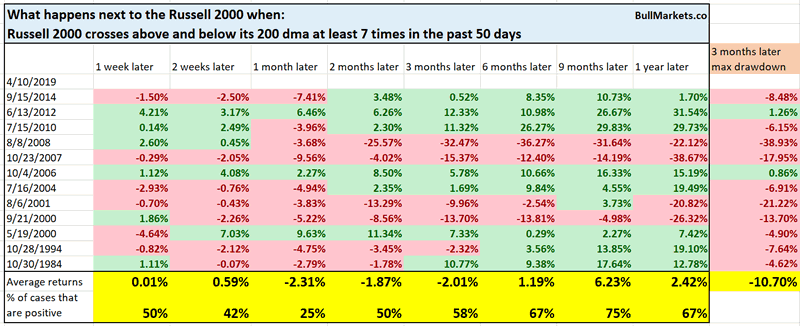
Small caps
As of Wednesday, the Russell 2000 fluctuated above and below its 200 dma 7 times in the past 50 days. This reflects some indecision in the stock market.
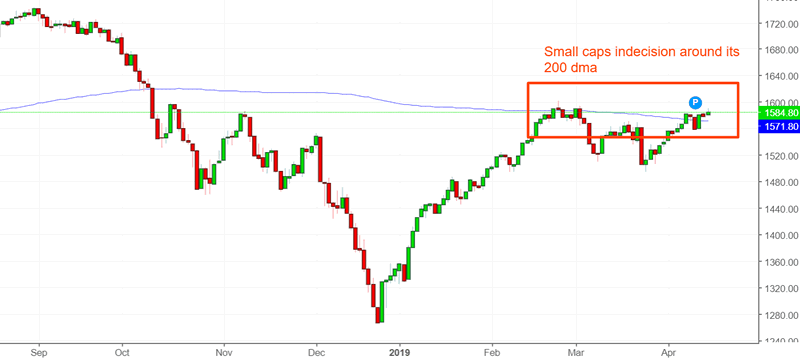
Historically, this was a short term bearish factor for the stock market 1 month later.
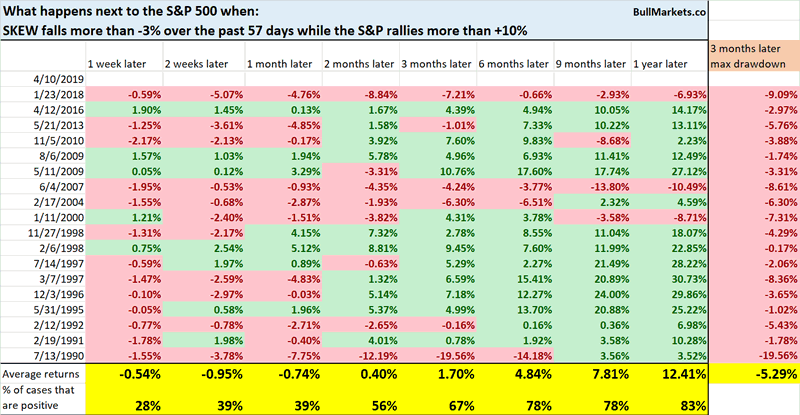
SKEW
SKEW is often viewed as a black swan indicator. As it rises, the potential risk in financial markets rises. It tends to move mostly inline with the S&P.
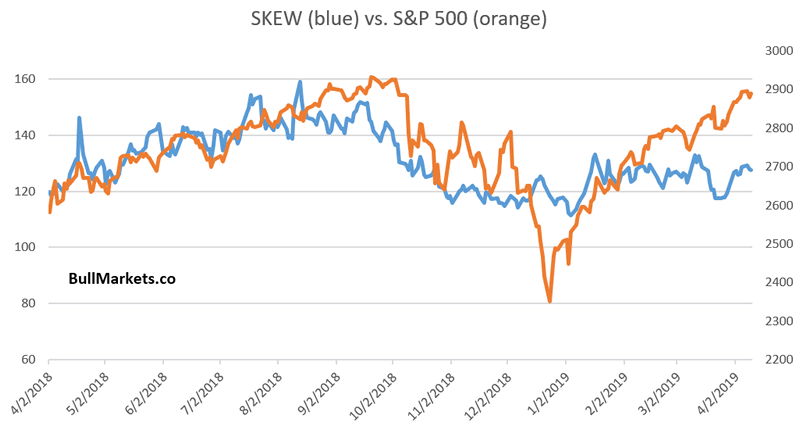
You can see that SKEW has diverged from the S&P 500 since January 2019. This is a short term bearish factor for stocks.
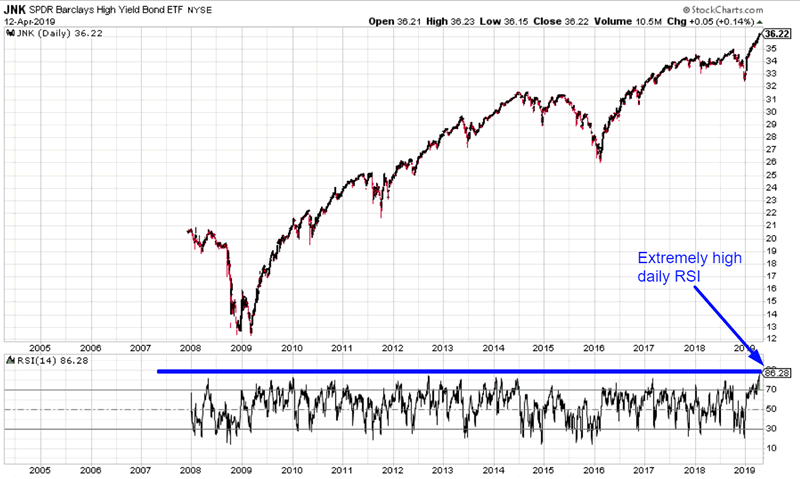
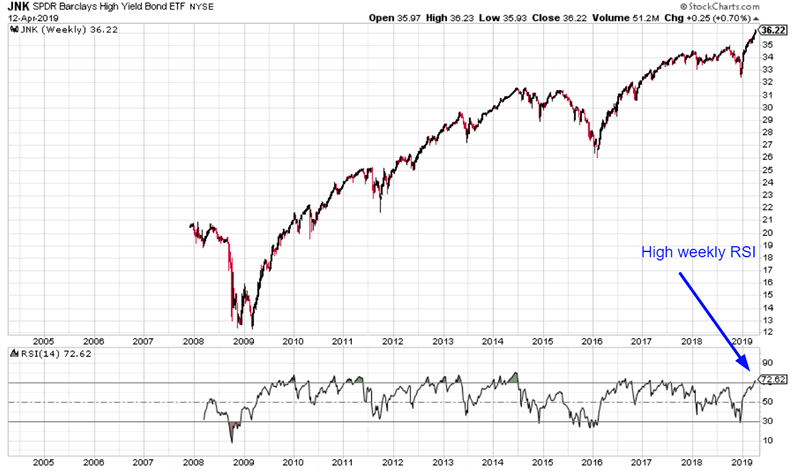
Junk Bonds
Junk bonds are on fire, recording one of the highest daily and weekly RSI readings in JNK’s short history.
Here’s what happen next when JNK’s 14 weekly RSI exceeds 72 (i.e. overbought).
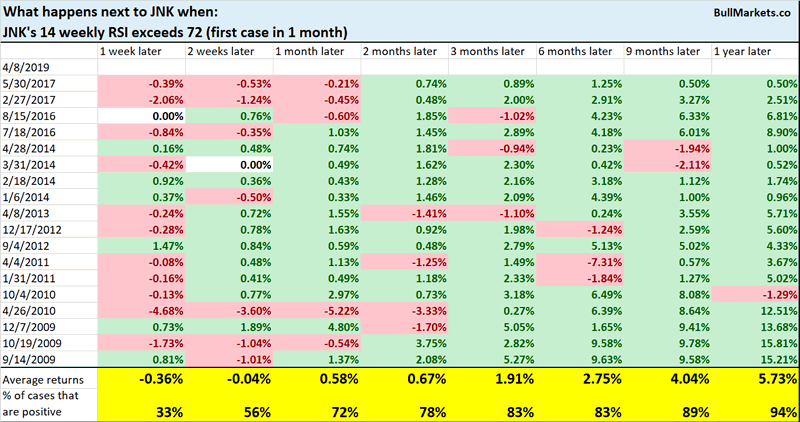
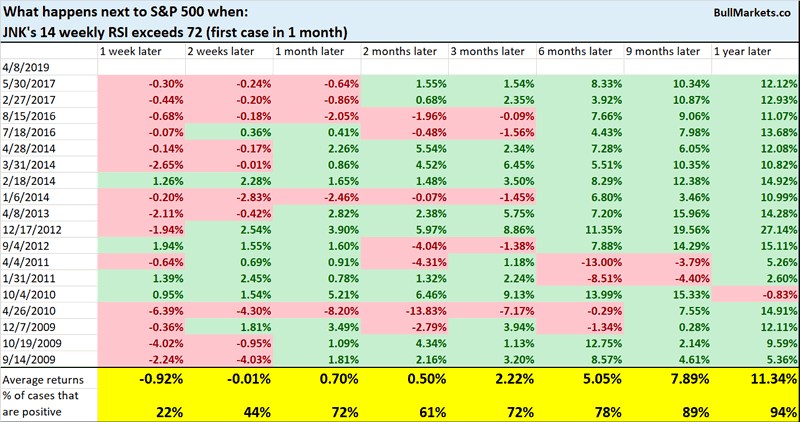
As you can see, this is a short term bearish factor for stocks and junk bonds.
*Don’t take the “up 94% of the time 1 year later” too seriously. The historical data is limited to only a bull market, so of course the 1 year forward returns would be ridiculously bullish.
Conclusion
Here is our discretionary market outlook:
- The U.S. stock market’s long term risk:reward is no longer bullish. In a most optimistic scenario, the bull market probably has 1 year left. Long term risk:reward is more important than trying to predict exact tops and bottoms.
- The medium term direction (e.g. next 6-9 months) is mostly mixed, although there is a bullish lean.
- We don’t predict the short term because the short term is always extremely random. At the moment, the short term does seem to have a slight bearish lean.
- In summary, 12-24 months = bearish, 12 months = neutral, 6-9 months = slightly bullish.
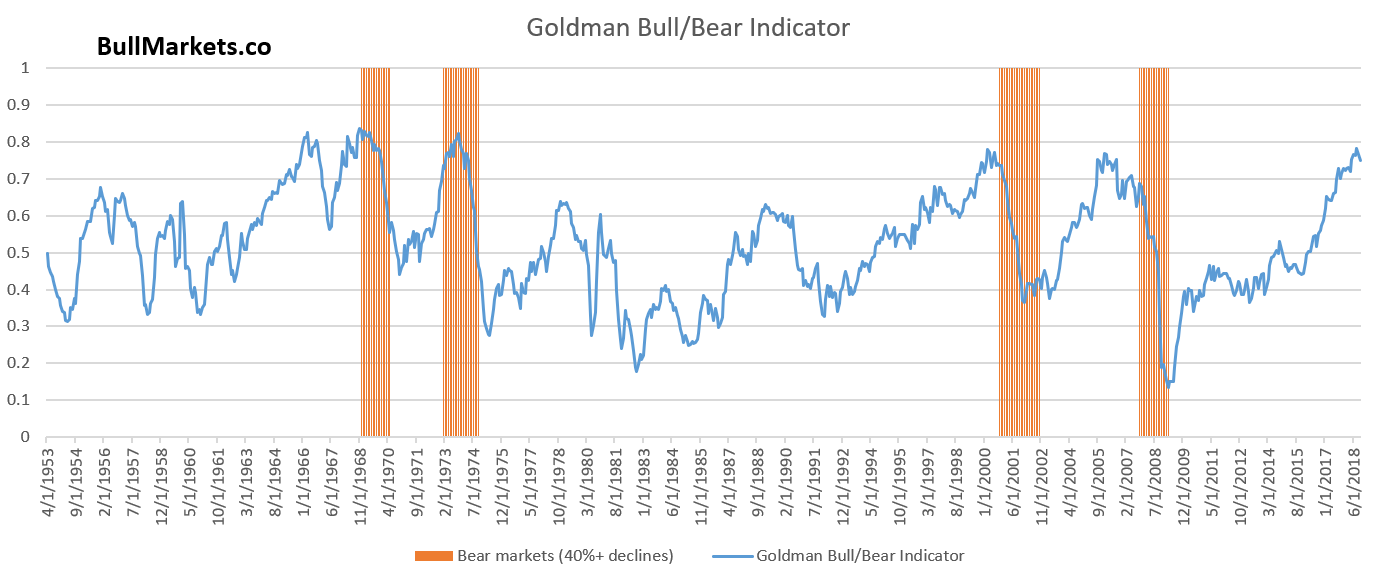
Goldman Sachs’ Bull/Bear Indicator demonstrates that while the bull market’s top isn’t necessarily in, risk:reward does favor long term bears.
Our discretionary outlook is not a reflection of how we’re trading the markets right now. We trade based on our quantitative trading models.
Members can see exactly how we’re trading the U.S. stock market right now based on our trading models.
Click here for more market studies
By Troy Bombardia
I’m Troy Bombardia, the author behind BullMarkets.co. I used to run a hedge fund, but closed it due to a major health scare. I am now enjoying life and simply investing/trading my own account. I focus on long term performance and ignore short term performance.
Copyright 2019 © Troy Bombardia - All Rights Reserved
Disclaimer: The above is a matter of opinion provided for general information purposes only and is not intended as investment advice. Information and analysis above are derived from sources and utilising methods believed to be reliable, but we cannot accept responsibility for any losses you may incur as a result of this analysis. Individuals should consult with their personal financial advisors.
© 2005-2022 http://www.MarketOracle.co.uk - The Market Oracle is a FREE Daily Financial Markets Analysis & Forecasting online publication.