


Powerful Signal from Gold GDX
Commodities / Gold and Silver Stocks 2019 May 24, 2019 - 06:04 AM GMTBy: P_Radomski_CFA

 Gold and silver declined a bit yesterday, but mining stocks reversed and closed the session higher. It seems that the miners showed strength, especially that they formed a bullish reversal candlestick. But did they? The reversal candlesticks should be confirmed by strong volume and what we saw in the GDX ETF yesterday was the lowest daily volume of the year. In fact, the GDX volume was lower than any volume that we saw in 2018. And 2017. And 2016. And even 2015. The last time when we saw as low a volume was on May 21, 2014 (yes, exactly 5 years earlier). So, how should we read this price action?
It is not the reversal or relative strength that is the powerful signal from the GDX. It’s the extremely low volume reading. What makes it so important right now, is that since March 2013 there were only four similar cases and they were all followed by exactly the same thing.
Quick declines.
Diving into the GDX Lessons
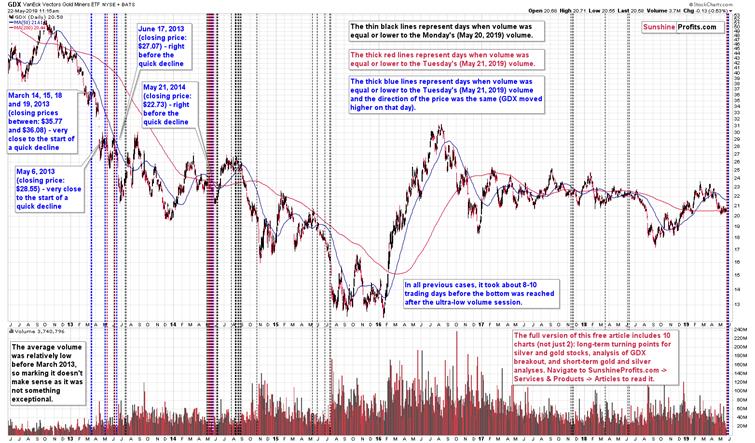
There are quite a few lines on the above chart, and they all have a purpose. Let’s start with the blue lines. These are the lines that represent sessions that are most similar to yesterday’s session. Namely, these are the sessions, during which GDX moved higher on volume that was as low (or lower) as yesterday’s (May 21, 2019) volume of 13.4M.
The red lines represent sessions that are also similar but not clearly so. These are the days, when the GDX moved either higher or when it was flat on volume that was as low as yesterday, or even lower.
Finally, the thin, black lines represent the days, when the GDX moved in either direction and the volume was equal or lower to Monday’s (May 20, 2019) volume of 17.6M. In other words, it’s a relatively broad category of low-volume days.
We marked all three kinds of similarity to increase the quality of the analysis. Of course, there are some analysts that don’t even wait for a given formation to be completed (especially inverse head-and-shoulders formations are popular among the gold promoters disguised as gold analysts) or don’t pay attention to where they get data from and arrive at incorrect conclusions regarding the major charts (gold to silver ratio clearly broke above its long-term resistance, it’s not at it), but we care too much about you and your financial success to feature something without researching it really thoroughly first. So, please bear with us, as we explain our methodology.
The more similar a given development is to what happened recently, the more likely it is that the follow-up action will also be repeated.
However, at the same time…
The more similar situations from the past confirm the same outlook and the less situations indicate a different outcome, the more likely it is that the follow-up action will also be similar.
There is usually a trade-off between the level of similarity and the number of similarities, so the question becomes, which ones should one take into account. Our reply is that one should use all of them, because they might confirm, or invalidate each-other, thus making a given forecast either more or less valuable. After all, the more signals point to the same outcome, the more likely it becomes.
The blue lines are the most similar cases, so let’s start with them. There were only 4 similar cases when volume was as low during a daily upswing as they were yesterday, and they were all in a relatively similar part of the year. The most recent case took place exactly 5 years ago. The previous cases took place on June 17 2013, May 6 2013, and in mid-March 2013 (on 14th, 15th, 18th, and 19th).
The follow-up action was very similar – a quick decline followed either immediately (June 17, 2013 and May 21, 2014) or shortly (May 6, 2013 and mid-March 2013). What is even more profound is that the next bottom formed in all these cases in about 2 weeks (8-10 trading days) after the low-volume session. This means that we are likely to see the next bottom at the end of May or very early in June.
Let’s consider the broader point of view. The red lines are present close to the blue lines, so they approximately confirm their indications. There are only three separate cases when we saw them, though, so they don’t provide much additional value. Why did we separate the blue and red lines if that’s the case? Because the blue lines are much more precise and by looking at all ultra-low-volume sessions we might have not detected this uncanny similarity. It’s always good to dig deeper into the data. At worst, you won’t find anything. At best, you’ll get a more precise forecast, a confirmation or invalidation of the more general indication. We have the former.
The broadest point of view – the black lines – confirm the bearish indication in general, but are not precise with regard to the follow-up action. The low volume sessions were seen right before some of the most powerful declines (multiple similar sessions in August 2014, in May, June and July 2015, and in mid-2018), but we also saw them before smaller rallies (mid-2013, June 2014, March 2018), and smaller declines (November 2017). Overall, low-volume sessions indicate bigger moves on the horizon which are usually to the downside. The precision in the prediction comes from the volume being not just low, but ultra-low. The extremely low value is what makes this situation stand out among other low-volume sessions. And the implications are much more bearish than if the volume was “just low”.
Let’s get back to the issue of confirmations. The more confirmations and the more they vary, the greater the chance that a given prediction will be realized.
Applying the GDX Lessons
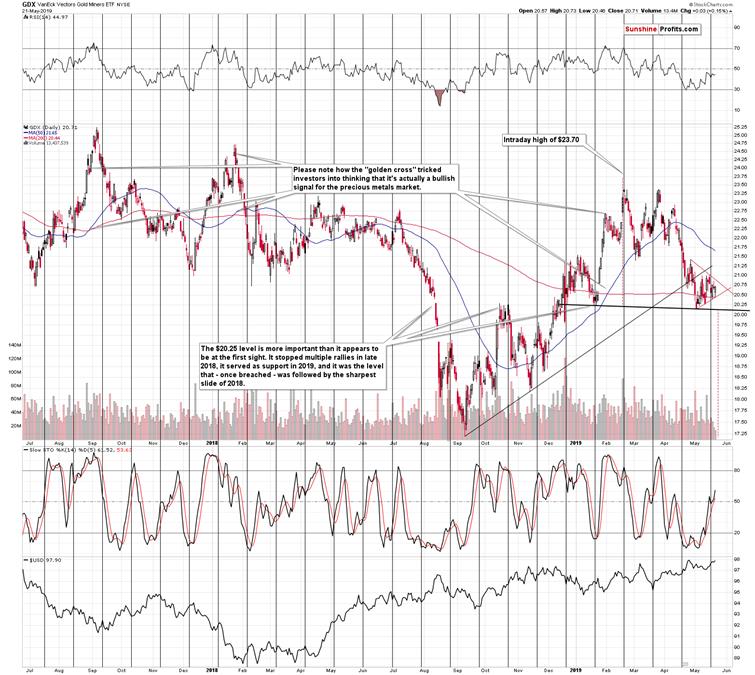
The GDX ETF is after a breakdown and the entire back and forth trading that we saw this month is a post-breakdown consolidation. In other words, that’s how the GDX is preparing for the next move.
But it’s actually more than that.
The recent consolidation took form of a triangle. This is important because of two reasons. First, triangles are usually continuation patterns. Second, the vertex of the triangle is likely to mark a reversal moment. And when is the vertex? At the turn of the month, which serves as a perfect confirmation of the ultra-low analogy that we described earlier.
On April 18th, we indicated that gold stocks are likely to decline to their January lows. And they did. That was not a major bottom – just an interim one. But it was enough to create the right shoulder of the potential head-and-shoulders formation (December – January price action being the left shoulder). This means that once GDX breaks below the early May lows, it’s likely to decline all the way down to the 2018 low of about $17.25. Naturally, this may change as new information becomes available, but that’s what seems likely at this time. Please note that if one wants to take advantage of this trade, it might be a good idea to place the exit price above the final target, just in case its off by several cents.
Today's article is a small sample of what our subscribers enjoy regularly. In its full version that is reserved for our subscribers, it also covers short-term gold analysis, silver with its near-term target, and the implications miners’ strength we just saw on Friday. To keep informed of both the market changes and our trading position changes exactly when they happen, we invite you to subscribe to our Gold & Silver Trading Alerts today.
Thank you.
Przemyslaw Radomski, CFA
Founder, Editor-in-chief
Tools for Effective Gold & Silver Investments - SunshineProfits.com
Tools für Effektives Gold- und Silber-Investment - SunshineProfits.DE
* * * * *
About Sunshine Profits
Sunshine Profits enables anyone to forecast market changes with a level of accuracy that was once only available to closed-door institutions. It provides free trial access to its best investment tools (including lists of best gold stocks and best silver stocks), proprietary gold & silver indicators, buy & sell signals, weekly newsletter, and more. Seeing is believing.
Disclaimer
All essays, research and information found above represent analyses and opinions of Przemyslaw Radomski, CFA and Sunshine Profits' associates only. As such, it may prove wrong and be a subject to change without notice. Opinions and analyses were based on data available to authors of respective essays at the time of writing. Although the information provided above is based on careful research and sources that are believed to be accurate, Przemyslaw Radomski, CFA and his associates do not guarantee the accuracy or thoroughness of the data or information reported. The opinions published above are neither an offer nor a recommendation to purchase or sell any securities. Mr. Radomski is not a Registered Securities Advisor. By reading Przemyslaw Radomski's, CFA reports you fully agree that he will not be held responsible or liable for any decisions you make regarding any information provided in these reports. Investing, trading and speculation in any financial markets may involve high risk of loss. Przemyslaw Radomski, CFA, Sunshine Profits' employees and affiliates as well as members of their families may have a short or long position in any securities, including those mentioned in any of the reports or essays, and may make additional purchases and/or sales of those securities without notice.
Przemyslaw Radomski Archive |
© 2005-2022 http://www.MarketOracle.co.uk - The Market Oracle is a FREE Daily Financial Markets Analysis & Forecasting online publication.