


US House Prices Yield Curve, Debt, QE4EVER!
Housing-Market / US Housing Jun 11, 2019 - 07:19 AM GMTBy: Nadeem_Walayat

Yield Curve
The yield curve (spread between 2 year and 10 year US bonds) continues to flirt with inversion, currently standing at 0.23%. Clearly the housing market is not comfortable with an inversion given the slowing trend since 0.5%.
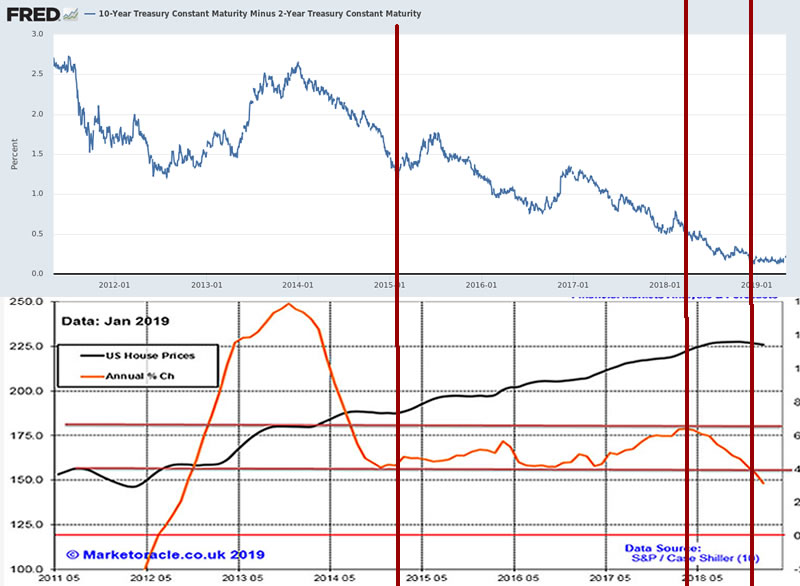
Since the near inversion during December, the Fed has clearly implemented some measures to PREVENT inversion, in attempts at bolstering market sentiment. And given that the fact that US inflation is below 2% then that gives the Fed some room act by CUTTING INTEREST RATES, rather than the consensus view of further Fed rate hikes.
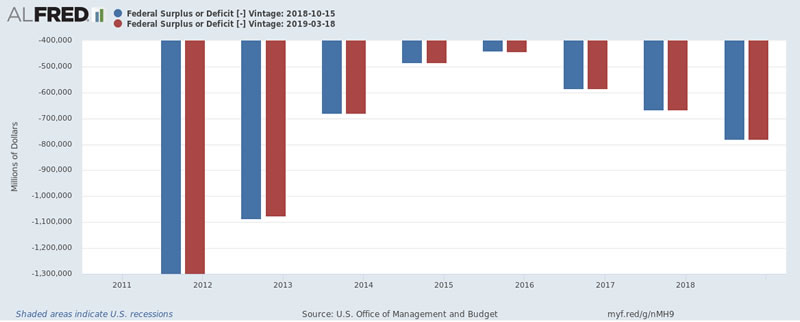
US Debt
The US debt mountain continues to balloon, with Trumponomics pushing it to $22 trillion. With the annual 'real' budget deficit of about $1.2 trillion (i.e. add $400 billion to the headline deficit figure) with the real deficit set to hit $1.5 trillion for 2019 ($23.5 trillion). And one can only imagine how far it will explode when the US actually enters into its next recession, maybe in 2021, 2022?
So what does the US economy suggest for US house prices. We'll lets discount there being a recession in 2019 and 2020 which would thus suggest rising US house prices for both of these years. However the analysis is resolving towards an US economic slowdown where we could see the US economy nearer to 2% than 3% by the end of the year. Economic activity dampened by the trend in rising unemployment which I am sure the Fed will counter by LOWERing Interest Rates and printing more juicy QE asset price inflating money. And as houses cannot be easily printed then this 'should' be supportive of house prices as long as the US economy doesn't actually tip into a recession for which currently there is little sign of, apart form bonds continuing to flirt with a yield curve inversion. Whilst of course there are continuing negative consequences of Trumps TRADE WAR!
QE4EVER!
A reminder folks that regardless of Fed propaganda and what you read in the mainstream press QE is 4 EVER! Once it starts it doesn't stop. As I iterated 2 months ago in my stock market analysis at the start of March (Stock Market Trend Forecast March to September 2019)
So why has the the stock market soared, what is that the stock market knows that most commentators and economists fail to comprehend? We'll for one thing there are the dovish signals out of the Fed which go beyond a pause in their interest rate hiking cycle in response to a subdued inflation outlook. Similarly the worlds other major central banks have their own reasons to avoid rate hikes, most notable of which is the Bank of England that has been busy propagandising the prospects of a NO Deal Brexit Armageddon in attempts to scare Westminister into avoiding EXITING the European Union in anything other than an ultra soft BrExit.
So on face value the stock market is clearly discounting not just a more accommodative interest rate environment but that QE REALLY IS FOREVER! Once it starts it DOES NOT STOP! As evidenced by the Fed's balance sheet first having exploded from about $800 billion to over $4.5 trillion, all to bailout the banking crime syndicate by inflating asset prices such as housing and stocks so as to generate artificial profits for the central bankers banking brethren. But none of this news, for I have written of it for a good 10 years now that QE will never stop as the worlds central banks will repeatedly expand QE to monetize government debt.
So I would not be surprised that WHEN the next crisis or recession materialises, QE will resume, by the end of which the Fed balance sheet will likely have DOUBLED to at least $8 trillion. And it is this which the stock market is DISCOUNTING! Just as has been the case for the duration of this QE driven stocks bull market that clearly paused during 2018 in the wake of mild Fed unwinding of its balance sheet. So forget any lingering Fed propaganda for the continuing unwinding it's balance sheet, the actual rate of of which has slowed to a trickle and thus we are probably near the point when the Fed ceases unwinding it's balance sheet because as I have often voiced that once QE starts it does NOT STOP!
So whatever form the NEXT crisis takes, the Fed will be at hand to print money and double its balance sheet, as it will periodically continue to supports asset prices such as housing which cannot be printed. We'll not until we see start seeing house building 3D printing drones emerge from the machine intelligence mega-trend that will fly around in swarms and erect designer houses anywhere on the planet.
This is the fifth in a series of articles that concludes in a new multi-year trend forecast for US house prices that seeks to replicate the accuracy of my last US House Prices trend forecast.
12 Jan 2013 - U.S. Housing Real Estate Market House Prices Trend Forecast 2013 to 2016)
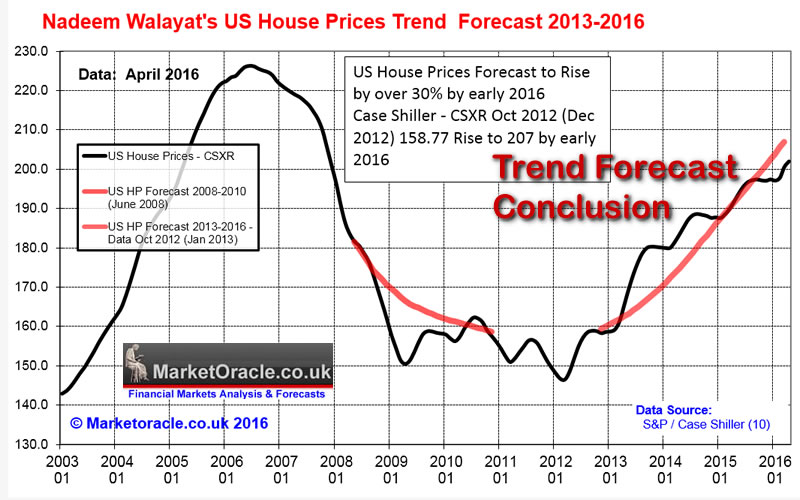
US House Prices Forecast Conclusion - As you read this, the embryonic nominal bull market of 2012 is morphing into a real terms bull market of 2013, with each subsequent year expected to result in an accelerating multi-year trend that will likely see average prices rise by over 30% by early 2016, which translates into a precise house prices forecast based on the most recent Case-Shiller House Price Index (CSXR) of 158.8 (Oct 2012 - released 26th Dec 2012) targeting a rise to 207 by early 2016 (+30.4%).
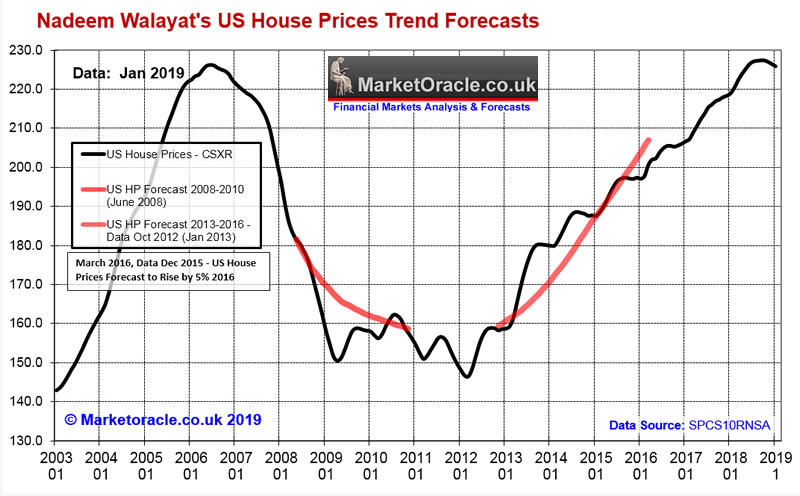
And here's how the US house prices trend forecast concluded early 2016, resulting in only a -2.5% deviation against the forecast so proving remarkably accurate, as had my preceding forecast during the bear market.
Which brings is to the present. Where despite all of the mainstream media noise and the usual perma doom mantra, the US housing bull market has continued to rage on upwards all the way to NEW ALL TIME HIGHS!
U.S. House Prices Analysis and Trend Forecast 2019 to 2021
The whole of this analysis has first been made available to Patrons who support my work: https://www.patreon.com/posts/us-house-prices-26484438
- Current State
- Momentum Analysis
- US ECONOMY - GDP
- Unemployment
- Inflation, Producer Prices Index
- Yield Curve, US Debt, QE4EVER!
- DEMOGRAPHICS
- US Home Builders Index (XHB)
- US Housing Market Real Terms BUY / SELL Indicator
- US House Prices 2019 to 2021 Trend Forecast Conclusion
- Peering into the Mists of Time
So for immediate First Access to ALL of my analysis and trend forecasts then do consider becoming a Patron by supporting my work for just $3 per month. https://www.patreon.com/Nadeem_Walayat.
Scheduled Analysis :
- Silver Price Trend Analysis
- China Stock Market SSEC
- UK Housing market series
- Stock Market Trend Forecast June 2019 Update
- Machine Intelligence Investing stocks sub sector analysis
Recent Analysis:
- Betting on the Tory Leadership Contest
- Gold Price Trend Forecast Summer 2019
- How Many Seats Will BrExit Party Win - EU Parliament Elections Forecast 2019
- Stock Market US China Trade War Panic! Trend Forecast May 2019 Update
- US House Prices Trend Forecast 2019 to 2021
- Bitcoin Price Trend Forecast 2019 Update
- Stock Market Dow Trend Forecast - April Update
- Top 10 AI Stocks for Investing to Profit from the Machine Intelligence Mega-trend
And ensure you are subscribed to my FREE Newsletter to get my public analysis in your email in box (only requirement is an email address).
Nadeem Walayat
Copyright © 2005-2019 Marketoracle.co.uk (Market Oracle Ltd). All rights reserved.
Nadeem Walayat has over 30 years experience of trading derivatives, portfolio management and analysing the financial markets, including one of few who both anticipated and Beat the 1987 Crash. Nadeem's forward looking analysis focuses on UK inflation, economy, interest rates and housing market. He is the author of five ebook's in the The Inflation Mega-Trend and Stocks Stealth Bull Market series that can be downloaded for Free.


 Nadeem is the Editor of The Market Oracle, a FREE Daily Financial Markets Analysis & Forecasting online publication that presents in-depth analysis from over 1000 experienced analysts on a range of views of the probable direction of the financial markets, thus enabling our readers to arrive at an informed opinion on future market direction. http://www.marketoracle.co.uk
Disclaimer: The above is a matter of opinion provided for general information purposes only and is not intended as investment advice. Information and analysis above are derived from sources and utilising methods believed to be reliable, but we cannot accept responsibility for any trading losses you may incur as a result of this analysis. Individuals should consult with their personal financial advisors before engaging in any trading activities.
Nadeem Walayat Archive |
© 2005-2022 http://www.MarketOracle.co.uk - The Market Oracle is a FREE Daily Financial Markets Analysis & Forecasting online publication.