


Stock Market ES Must Hold Above 2800 Or The Selling Will Intensify
Stock-Markets / Stock Markets 2019 Aug 27, 2019 - 06:34 PM GMTBy: Chris_Vermeulen

 First off, we were so happy to hear from all of our followers over the weekend and early today regarding their support for our incredible market predictions – specifically the call about the August 19th breakdown prediction. We stuck to our guns believing in our predictive modeling systems and our research team. We knew it would be just a matter of time before the weakness our models were showing us to actualize in a real price breakdown. We want to thank all of you who wrote to us and thanked us and our team for their hard work and dedication.
Now, we’ll highlight some recent events in the ES chart (S&P500 E-Mini Futures) and how it related to the bigger picture in the markets.
Before we get into the details of the market recovery today, we want all of you to understand that is natural for the markets to move in rotational waves as price establishes new highs or lows. In fact, it is essential and healthy for the markets to do this. When the markets move in an unnatural way by trending excessively over short periods of time, it reflects an imbalance in the fundamentals of the markets or the core elements of supply/demand economics. When the bottom falls out of a market, for example, it is usually because of some type of external news item or some other type of external factor/event. The markets themselves naturally have a way of processing expectations and price value through the process of buying and selling in an open market.
Therefore, as we continue this research post, please understand that any further price breakdown will likely become a process of price waves or rotations over the next few days and weeks that continue to break the most recent series of upward sloping highs and lows (from January 2019 till July 2019). But first, be sure to opt-in to our free stock market forecast newsletter.
Let’s get started with the analysis.
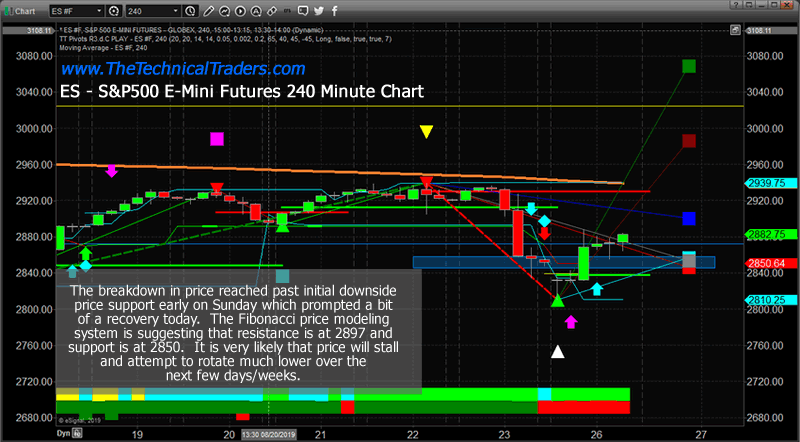
240 Minute ES Chart Highlights
This first 240 minute ES chart highlights the intraday rotational price structure and how the Fibonacci price modeling system is currently identifying 2850 to 2897 as a key Support/Resistance level for the price. Initially, as the breakdown in price happened on Friday and late Sunday, price blew past the projected Fibonacci target levels. This can sometimes happen in extended trending or when outside news drives market price one direction or another. The basics of Fibonacci price theory are that price will attempt to revert to within the last trending range before attempting to establish a new price highs or new price low. So with each subsequent higher or lower move within a trend, the price will attempt to revert within that range before attempting another trend/move.
In this case, the 2850 to 2897 level is the target level identified by the Fibonacci Target Levels that we want to watch. This is where the price will likely initiate the next big move from and we believe it will be to the downside.
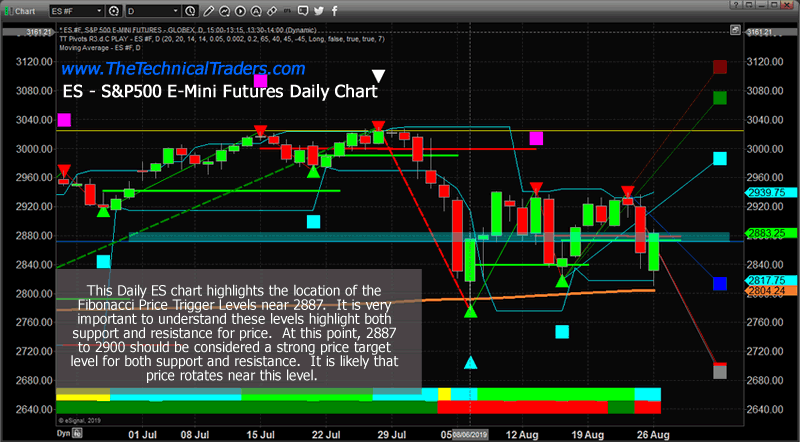
Daily Chart Highlights
This Daily chart highlights the 2887 level for both the LONG and SHORT Fibonacci Trigger Price Level. The one thing we want you to take away from this research article is how the levels all seem to align with one another. This Daily chart is suggesting levels that align with the 240-minute chart. This is very important and provides consistency across multiple intervals for the Fibonacci system.
At this point 2887 is critical for price. Any measure to stay above this level would provide greater confidence that some type of price recovery may form in the future. Any failure to stay above this level would mean the breakdown should continue lower.
The last item we want to highlight on this Daily chart is the 2817 level (the BLUE projected Fibonacci target level). This aligns very closely with the data you’ll see on the next Weekly chart. Pay attention to how these levels work together to pinpoint price structures.
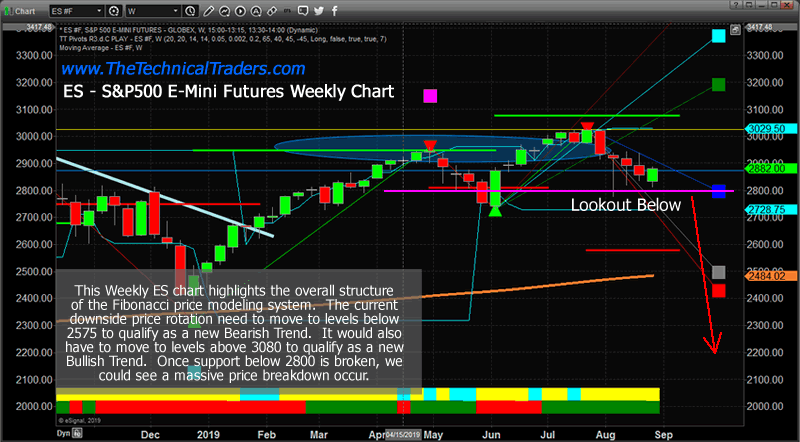
Weekly ES chart
This Weekly ES chart shows the bigger Fibonacci price modeling system and the key levels we are watching on the longer-term charts. Obviously, the 2790 to 2800 level is critical on this chart. That is a price level that aligns with the BLUE Fibonacci downside target level and the past Bearish Fibonacci Trigger Level from June 2019. It is very likely that this level will be the last level of defense for a price if the breakdown continues. This weekly chart also highlights that we need to see price move below 2575 to qualify as a “new Bearish Trend” on this chart. So we have a long way to go before we can really attempt to confirm a new longer-term Bearish trend is in place.
The way the Fibonacci modeling system address volatility can sometimes extend the range of the Trigger levels based on how price reacts and sets up. In this case, because of the extended volatility in the markets and because of how the price has rotated recently, the Fibonacci price modeling system will not confirm a new bearish price trend until price moves below 2575.
CONCLUDING THOUGHTS:
This sets up a type of “ladder pricing event” in our future. First, the 2887 level (from the Daily chart). Then 2850 (from the 240-minute chart). Then the 2795 to 2817 level. After that – LOOK OUT BELOW.
Over the next few days and weeks, we’ll see how these levels are targeted and/or breached as the price continues to rotate. We believe this downside rotation is just starting at this point and we have yet to really break below the 2728 lows from June 2019. Price MUST break these levels if the true breakdown move we are expecting is going to take place. Get ready for some really great trades – they are about to unload on all of us.
Check out these other exciting charts full of opportunities that we will be sharing with our followers.
Join us with a subscription to lock in the lowest rate possible and ride our coattails as we navigate these financial market and build wealth while others lose nearly everything they own during the next financial crisis.
Be prepared for these incredible price swings before they happen and learn how you can identify and trade these fantastic trading opportunities in 2019, 2020, and beyond with our Wealth Building & Global Financial Reset ETF Newsletter. You won’t want to miss this big move, folks. As you can see from our research, everything has been setting up for this move for many months.
As a technical analysis and trader since 1997, I have been through a few bull/bear market cycles. I believe I have a good pulse on the market and timing key turning points for both short-term swing trading and long-term investment capital. The opportunities starting to present themselves will be life-changing if handled properly.
FREE GOLD OR SILVER WITH MEMBERSHIP!
Kill two birds with one stone and subscribe for two years to get your FREE PRECIOUS METAL and get enough trades to profit through the next metals bull market and financial crisis!
Chris Vermeulen
www.TheTechnicalTraders.com
Chris Vermeulen has been involved in the markets since 1997 and is the founder of Technical Traders Ltd. He is an internationally recognized technical analyst, trader, and is the author of the book: 7 Steps to Win With Logic
Through years of research, trading and helping individual traders around the world. He learned that many traders have great trading ideas, but they lack one thing, they struggle to execute trades in a systematic way for consistent results. Chris helps educate traders with a three-hour video course that can change your trading results for the better.
His mission is to help his clients boost their trading performance while reducing market exposure and portfolio volatility.
He is a regular speaker on HoweStreet.com, and the FinancialSurvivorNetwork radio shows. Chris was also featured on the cover of AmalgaTrader Magazine, and contributes articles to several leading financial hubs like MarketOracle.co.uk
Disclaimer: Nothing in this report should be construed as a solicitation to buy or sell any securities mentioned. Technical Traders Ltd., its owners and the author of this report are not registered broker-dealers or financial advisors. Before investing in any securities, you should consult with your financial advisor and a registered broker-dealer. Never make an investment based solely on what you read in an online or printed report, including this report, especially if the investment involves a small, thinly-traded company that isn’t well known. Technical Traders Ltd. and the author of this report has been paid by Cardiff Energy Corp. In addition, the author owns shares of Cardiff Energy Corp. and would also benefit from volume and price appreciation of its stock. The information provided here within should not be construed as a financial analysis but rather as an advertisement. The author’s views and opinions regarding the companies featured in reports are his own views and are based on information that he has researched independently and has received, which the author assumes to be reliable. Technical Traders Ltd. and the author of this report do not guarantee the accuracy, completeness, or usefulness of any content of this report, nor its fitness for any particular purpose. Lastly, the author does not guarantee that any of the companies mentioned in the reports will perform as expected, and any comparisons made to other companies may not be valid or come into effect.
Chris Vermeulen Archive |
© 2005-2022 http://www.MarketOracle.co.uk - The Market Oracle is a FREE Daily Financial Markets Analysis & Forecasting online publication.