


Could Hong Kong Disrupt China & The Global Markets Further?
Stock-Markets / Chinese Stock Market Sep 02, 2019 - 06:49 PM GMTBy: Chris_Vermeulen

 Reading the news this weekend and watching the chaos in Hong Kong, one has to wonder how this violence and disruption in commerce is really affecting the Asian and global markets. Many different news sources are already reporting that Chinese economic data continues to show weakness over the past 4 to 5+ months.
Additionally, Hong Kong, being a strategic source of income and business for the western world, has been disrupted with riots, protests and not violence as a result of a political battle between Chinese rulers and local Hong Kong residents.
It seems obvious to anyone outside of this situation that neither side is about to stop their actions any time soon and that means we are going to experience even further disruptions to the global markets and local markets. Right now, our greatest concern is that the disruption in economic activity in China/Asia will result in a “cold” in the US and other foreign markets.
Our August 19th call for a potential US market breakdown was stalled because of recent news that China and the US would begin talks again attempting to resolve the trade issues. Yet, we know these talks may last many months with no real progress in terms of lifting tariffs or real concrete outcomes. We don’t believe the US is going to remove tariffs or ease up on trade-related factors until we see real progress made by China. This would suggest we are in for a long-haul in terms of real relief in the markets.
Our research team still stands behind our August 19th breakdown call. Our super-cycle research suggests that the US and global markets are poised for a price breakdown and we believe the recent news events have stalled this price move. Particularly, we point to the nearly -1100 point price drop on August 22 through 26, just days before the news that China was willing to engage in new talks with the US about trade. This move would have likely continued to break lower, as we predicted, had the Chinese not announced their intent to try to relieve pressures on the economy and the global economy. Before we get into more details, be sure to opt-in to our Free Market Forecast and Trade Ideas Newsletter
We may have to give the Chinese credit for moving the markets by simply making an announcement that they were “willing” to engage in talks at a critical time when a price breakdown appeared to be executing. That one statement changed the way the markets perceived the future. Global traders rotated to a perspective of “hey – maybe the Chinese are finally going to negotiate a solution”. We believe this is a stall tactic while the Chinese attempt to work another angle to protect their markets/assets.
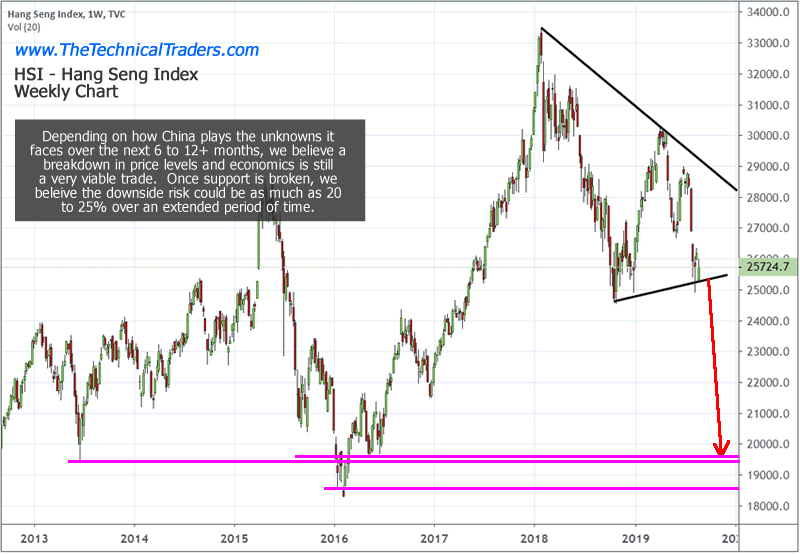
Hang Seng Index Weekly Chart
The Hang Seng Index Weekly chart highlights the extreme weakness of price over the past 12+ week. A dramatic downturn from $30,000 to $25,725 has transpired and support near a previous trend channel is now acting as a final floor for price. Once this level is broken, we believe the Hang Seng Index could fall to $21,500 or much lower and set off a wave of corporate bankruptcies and bond defaults.
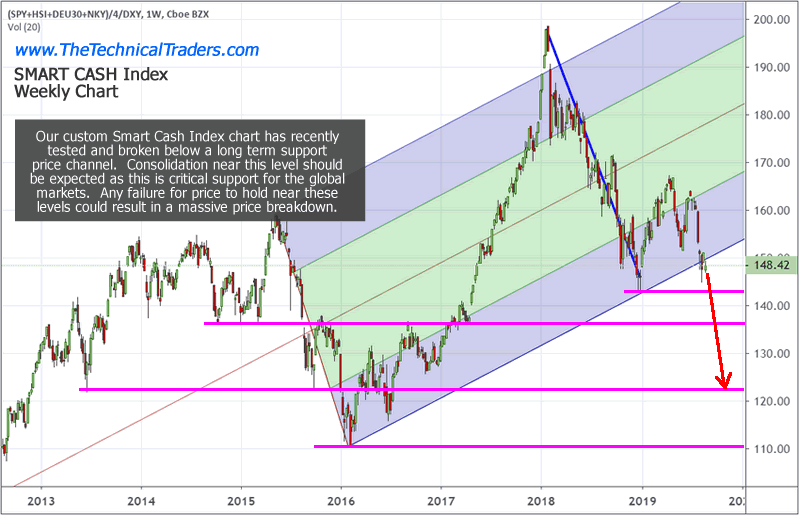
Custom Smart Cash Index Weekly Chart
Our Custom Smart Cash Index Weekly chart is set up in a similar format. It shows that the peak in value near early 2018 was the true peak in economic activity and price valuation. Everything beyond that peak has resulted in weaker and more contracted price moves. This suggests global traders have already been pulling capital out of the markets in preparation for some type of price correction. It certainly does not align with the most recent “new price highs” in 2019 for many of the US major Indexes.
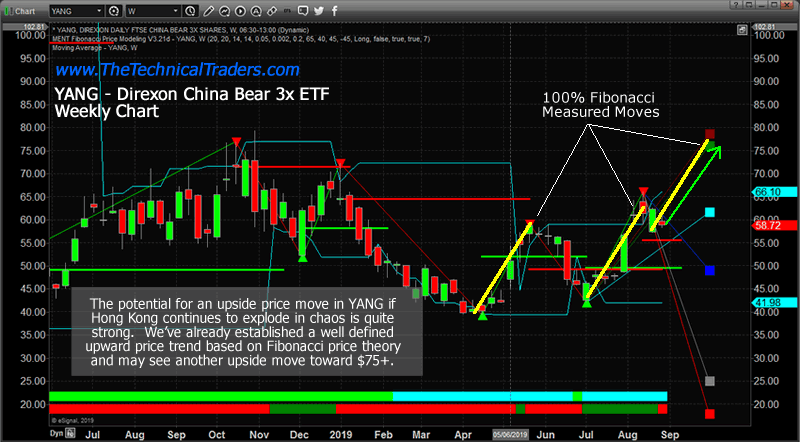
YANG Fibonacci 100% Measured Move
We believe a very strong potential for a Fibonacci 100% measured move in YANG ETF exists on a price breakdown as a result of the chaos and turmoil that will likely continue in Hong Kong and China. We’ve seen at least two of these 100% measured moves complete over the past 6 months and our Fibonacci price modeling system is suggesting a target level above $75 which happens to align with another 100% Fibonacci measured move.
Current support near $55 would be an excellent area for a stop level and targets near $65 & $72 would be appropriate for skilled technical traders. The risk at this time is related to the support level near $55 and the potential for some positive outcome in Hong Kong or other trade-related news. Any further deterioration of the situation in Hong Kong could result in a very quick price drop in the Asian markets.
CONCLUDING THOUGHTS:
As we’ve been suggesting for more than 12 months, 2019 and 2020 are going to be fantastic years for skilled technical traders. The potential for big trades (20% or more), like this YANG trade, will continue to set up in different sectors and global markets. All we need to do is stay on top of the opportunities to find ways to profit from these moves.
We would advise traders and investors to take advantage of these higher prices to pull profits out of open long positions and take some risk off the table at this juncture in price. We entered a new trade today and our portfolio is primed and ready for big moves going into next week.
We believe our super-cycle research and other proprietary modeling systems are suggesting that price weakness will dominate the markets for the next few months. Ride my coattails as I navigate these financial market and build wealth while others lose nearly everything they own during the next financial crisis and recession.
In short, you should be starting to get a feel of where commodities and asset class is headed for the next 8+ months. The next step is knowing when and what to buy and sell as these turning points take place, and this is the hard part. If you want someone to guide you through the next 12-24 months complete with detailed market analysis and trade alerts (entry, targets and exit price levels) join my ETF Trading Newsletter.
FREE GOLD OR SILVER WITH SUBSCRIPTION!
Chris Vermeulen
www.TheTechnicalTraders.com
Chris Vermeulen has been involved in the markets since 1997 and is the founder of Technical Traders Ltd. He is an internationally recognized technical analyst, trader, and is the author of the book: 7 Steps to Win With Logic
Through years of research, trading and helping individual traders around the world. He learned that many traders have great trading ideas, but they lack one thing, they struggle to execute trades in a systematic way for consistent results. Chris helps educate traders with a three-hour video course that can change your trading results for the better.
His mission is to help his clients boost their trading performance while reducing market exposure and portfolio volatility.
He is a regular speaker on HoweStreet.com, and the FinancialSurvivorNetwork radio shows. Chris was also featured on the cover of AmalgaTrader Magazine, and contributes articles to several leading financial hubs like MarketOracle.co.uk
Disclaimer: Nothing in this report should be construed as a solicitation to buy or sell any securities mentioned. Technical Traders Ltd., its owners and the author of this report are not registered broker-dealers or financial advisors. Before investing in any securities, you should consult with your financial advisor and a registered broker-dealer. Never make an investment based solely on what you read in an online or printed report, including this report, especially if the investment involves a small, thinly-traded company that isn’t well known. Technical Traders Ltd. and the author of this report has been paid by Cardiff Energy Corp. In addition, the author owns shares of Cardiff Energy Corp. and would also benefit from volume and price appreciation of its stock. The information provided here within should not be construed as a financial analysis but rather as an advertisement. The author’s views and opinions regarding the companies featured in reports are his own views and are based on information that he has researched independently and has received, which the author assumes to be reliable. Technical Traders Ltd. and the author of this report do not guarantee the accuracy, completeness, or usefulness of any content of this report, nor its fitness for any particular purpose. Lastly, the author does not guarantee that any of the companies mentioned in the reports will perform as expected, and any comparisons made to other companies may not be valid or come into effect.
Chris Vermeulen Archive |
© 2005-2022 http://www.MarketOracle.co.uk - The Market Oracle is a FREE Daily Financial Markets Analysis & Forecasting online publication.