


Stock Market Trend Forecast October to December 2019 (2/2)
Stock-Markets / Stock Markets 2019 Oct 25, 2019 - 02:03 PM GMTBy: Nadeem_Walayat

This is part 2 of 2 of my in-depth analysis that concludes in a detailed trend forecast for the DJIA stocks index into the end of 2019. However, the whole of this analysis was first made available to Patrons who support my work. Dow Stock Market Trend Forecast Oct to Dec 2019
- Stock Market Trend Forecast Current State
- Yield Curve Inversion Current State
- US Presidential Cycle
- ELLIOTT WAVES
- Short-term Trend Analysis
- Long-term Trend Analysis
- MACD
- VIX
- SEASONAL ANALYSIS
- Formulating a Stock Market Forecast
- Dow Stock Market Forecast Conclusion
- AI Stocks Buying Levels
So for immediate first access to ALL of my analysis and trend forecasts then do consider becoming a Patron by supporting my work for just $3 per month. https://www.patreon.com/Nadeem_Walayat.
Yield Curve Inversion Current State
An inverted yield curve is basically when the yield on 2 year US government bond exceeds the 10 year US bond yield as worried investors opt to disinvest from risky assets in favour of safer longer term government bonds thus driving down long bond yields below that of nearer term bonds. And the closer the yield curve gets towards towards an inversion the greater the likelihood for a future recession. So far the yield curve inversion has successfully forecast the last 3 economic downturns in the United States. Though the YCI has proved less reliable elsewhere, especially for Australia.
The Fed put up a valiant effort to prevent a yield curve inversion 'recession indicator' all year finally failing during late August which triggered a barrage of action to immediately reverse the inversion most notable of which was Septembers rate cut. Does anyone recall the Feds rate hike mantra of less than a year earlier? Which illustrates watch what they do rather than what they say.
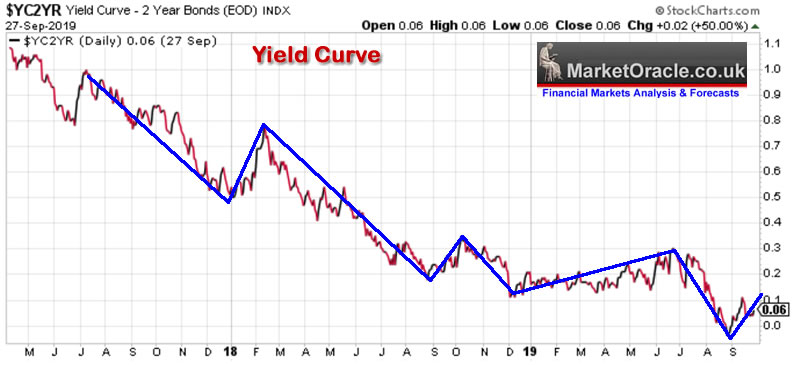
So US bond long bond yields have risen, though at 0.06. the Fed clearly see's much more work to be done, which means to expect US long bonds to fall in price as the Fed attempts to bring the yield curve spread back into the years range of 0.10 to 0.30, by the Fed engineering lower short-term rates and higher long-term rates which should be a net positive for stocks i.e. favouring risk assets. And not to forget that even if the yield curve inversion does herald a recession, historically it can take 10 - 20 months from inversion for the recession to materialise.
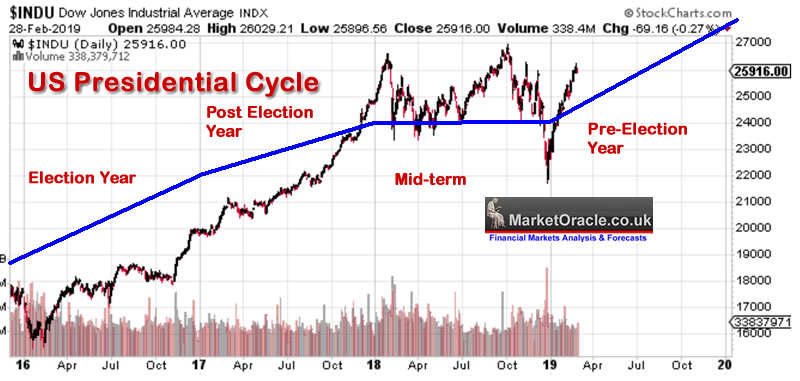
Stock Market US Presidential Cycle
The US Presidential cycle pattern has continued to prove REMARKABLY ACCURATE in terms of flagging future stock market price action as the charts over the past 15 months illustrate, where the basic pattern for the US Presidential cycle is for a strong election year and post election year, followed by weak Mid-term then a strong pre-election year.
July 2018
Feb 2019
Sept 2019
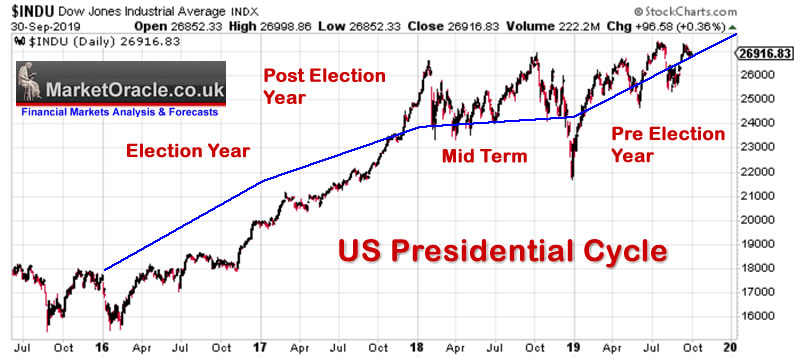
Therefore the election cycle is bullish for stocks for the remainder of 2019 and in the run upto the 2020 election.
ELLIOTT WAVES
My analysis of Feb 2019 concluded in expectations for a 5 wave bull run during 2019 targeting new all time highs of around 28k.
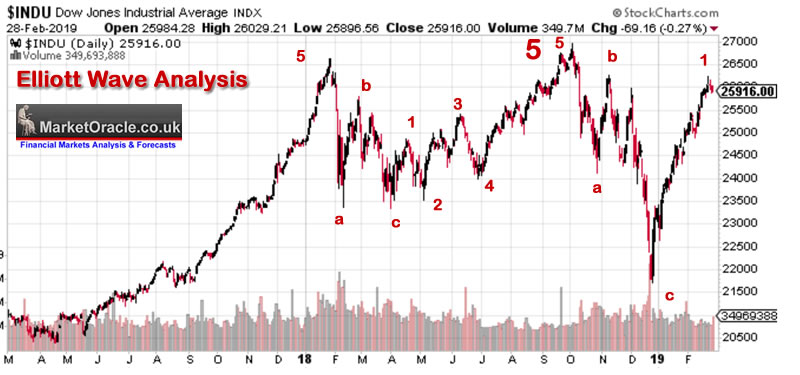
Subsequent price action resolved in a 5 wave advance with a lower high during September, and before you comment that the lower September high cannot be a fifth wave peak, well remember that I don't subscribe to any tenants of the elliott wave theory, rather interpret it as I see it, and I see it as a 5 wave advance with a fifth wave failure to make a new high. Where TA is concerned be FLEXIBLE and SKEPTICAL! For there is NO Holy GRAIL, on it's own EWT is a coin flop, if one keeps that in mind then one keeps their feet on the ground.
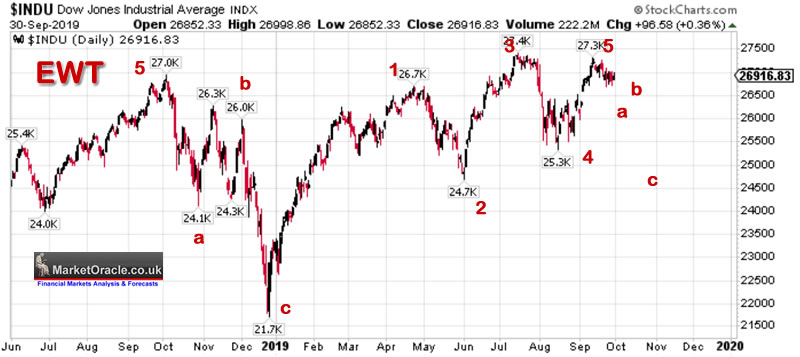
The fifth wave now implies a significant correction is likely, with the basic expected pattern being an ABC that should carry the Dow to at least 24,700 and likely lower, maybe even spike below 24,000.
TREND ANALYSIS
Short-term Trend Analysis
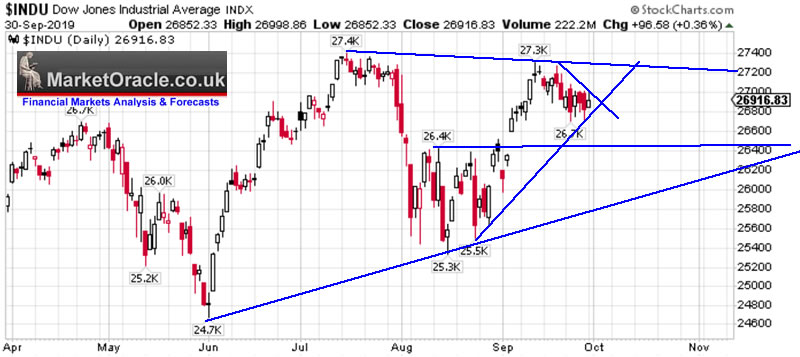
The Dow's failure to clear the all time high has triggered a correction. However what stands out is that the correction is relatively mild, which suggests that the Dow should have another assault at the high with resistance currently around 27,300. And support rising firm the trend line at 25,800.
So on the short-term basis the Dow looks bullish. Implies an imminent move higher.
Long-term Trend Analysis
The past 2 years have seen repeated failures to decisively breakout to new highs resolving in significant corrections. Last year's failure resolved in a major downtrend from 27k to 21.7k. Are we in for a similar fate this year?
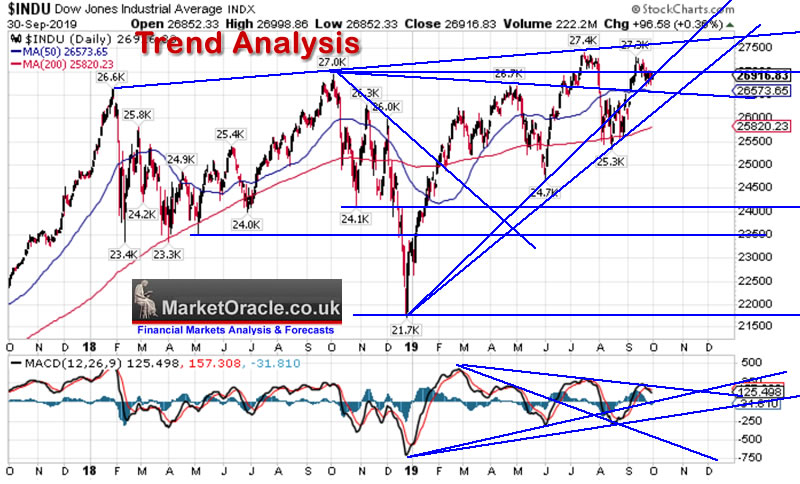
RESISTANCE : There is heavy over head resistance above 27000 where each break above soon snaps back to under 27k.
SUPPORT is along a series of highs in the range of 26,500. So any decline should see a bounce of sorts from that level. Major support kicks in around 24k, and then we have the spike low of 21.7k.
TRENDLINES- Rising trend line support from 21.7k low is at 26,100 rising to 26,600 by the end of October. A failure of this trend line would trigger a significant decline to 25,300 which probably won't hold and thus target 24,700, which probably also won't hold and thus see a decline towards 24k. Therefore this is a significant trendline, a break of which would trigger a significant sell off.
The overall trend picture is one of limited upside with significant downside risks. Which calls for portfolio hedging strategies such as put options.
MACD - MACD is bearish, lower highs and lows. Warning that a sell off is looming.
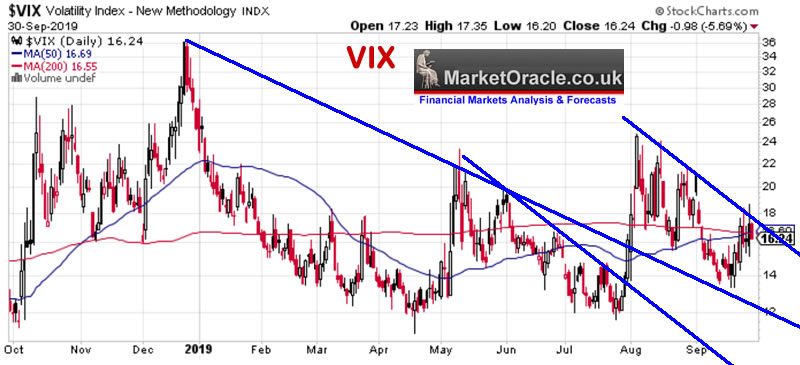
VIX
VIX is in a falling range from 26 to 13. Which should be bullish for stocks. However, the pattern is resembling that of October / November last year, which was a prelude to the Decembers steep sell off. August saw a higher high and September a high low. So we could be witnessing the calm before the storm.
SEASONAL ANALYSIS
The basic stock market seasonal pattern is after a weak Jan / Feb, strong March / April, a peak in May, down into June, a Strong July / August peaking in Sept for a wobble into October that sets the scene for a strong rally into the end of the year.
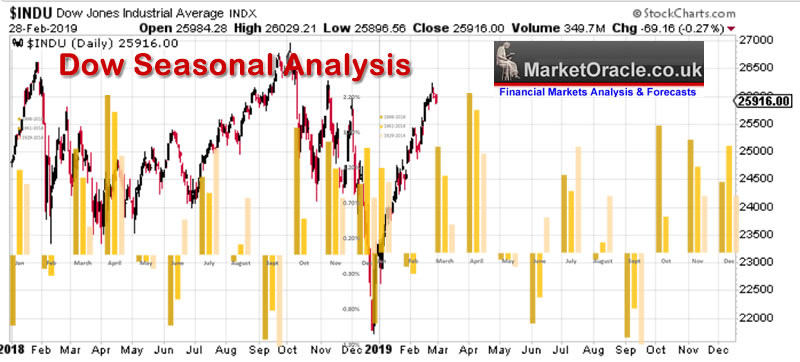
This year we saw an inversion for August and September which implies October should resolve to form. With a rally during November and December.
Formulating a Stock Market Forecast
We are now entering the seasonally weakest period of the year. The question mark is how low could the Dow go before it heads higher into the end of the year. for that will determine whether the Dow will be able to set a new all time high let alone attain anywhere near Dow 30k.
The Presidential cycle is bullish, Elliott wave is bearish. short-term technical's are bullish, long-term technical's are bearish. Macd is bearish, VIX is bearish, Seasonal's are supportive but prone to inversions, all of this in the context of being in an bull market.
So whilst we are unlikely to see an end of this bull market. However, I am finding it difficult seeing the Dow make a break to Dow 30k from where it stands today, likely the best it will manage to achieve by year end is Dow 28k.
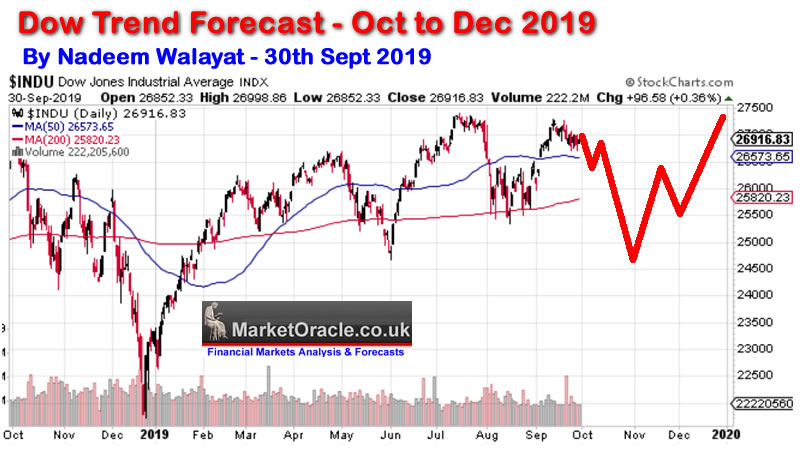
Dow Stock Market Forecast Conclusion
Therefore my forecast conclusion as illustrated by the below chart is for the Dow to target a trend towards Dow 27,500 by the end of this year following a significant correction during October that could see the Dow trade as low as 24k.
AI Stocks Buying Levels
My consistent view for the DURATION of this STOCKS BULL MARKET has been to view all corrections, flash crashes, technical bear markets (20% drops) as BUYING OPPORTUNITIES. Where the greater the deviation from the high the greater the buying opportunity presented. Which was the case at the start of August hence my article How to Invest in AI Stocks with Buying Levels. Listing levels that I would look at buying AI stocks 'should' they correct.
So here once more here my buying levels for all of stocks mentioned in my AI series this year.
That a sell off during October may generate buying opportunities for. Though, I suspect you may find that the 'good' stocks that are winning the AI supremacy war once more fail to decline.
The whole of this analysis was first been made available to Patrons who support my work. Dow Stock Market Trend Forecast Oct to Dec 2019
So for immediate first access to ALL of my analysis and trend forecasts then do consider becoming a Patron by supporting my work for just $3 per month. https://www.patreon.com/Nadeem_Walayat.
Recent Analysis includes:
- Dow Stock Market Trend Forecast October Update
- Dow Stock Market Trend Forecast Oct to Dec 2019
- Bitcoin Price Analysis and Trend Forecast
- British Pound Trend Forecast vs "Dead in a Ditch" BrExit Civil War General Election Chaos
- Stock Market Trend Forecasts When Mega-Trends Collide
- How to Invest in AI Stocks with Buying Levels
- China SSEC Stock Market Fundamentals and Trend Analysis Forecast
- Silver Investing Trend Analysis and Price Forecasts 2019 Update
Scheduled Analysis
- UK Housing market series
- Machine Intelligence Investing stocks sub sector analysis
- Gold / Silver Updates
- US Dollar Index
- NASDAQ
- EuroDollar Futures
- EUR/RUB
And ensure you are subscribed to my ALWAYS FREE newsletter for my next in-depth analysis.
Your Analyst
By Nadeem Walayat
Copyright © 2005-2019 Marketoracle.co.uk (Market Oracle Ltd). All rights reserved.
Nadeem Walayat has over 30 years experience of trading derivatives, portfolio management and analysing the financial markets, including one of few who both anticipated and Beat the 1987 Crash. Nadeem's forward looking analysis focuses on UK inflation, economy, interest rates and housing market. He is the author of five ebook's in the The Inflation Mega-Trend and Stocks Stealth Bull Market series that can be downloaded for Free.


 Nadeem is the Editor of The Market Oracle, a FREE Daily Financial Markets Analysis & Forecasting online publication that presents in-depth analysis from over 1000 experienced analysts on a range of views of the probable direction of the financial markets, thus enabling our readers to arrive at an informed opinion on future market direction. http://www.marketoracle.co.uk
Disclaimer: The above is a matter of opinion provided for general information purposes only and is not intended as investment advice. Information and analysis above are derived from sources and utilising methods believed to be reliable, but we cannot accept responsibility for any trading losses you may incur as a result of this analysis. Individuals should consult with their personal financial advisors before engaging in any trading activities.
Nadeem Walayat Archive |
© 2005-2022 http://www.MarketOracle.co.uk - The Market Oracle is a FREE Daily Financial Markets Analysis & Forecasting online publication.