


Stock Market Trend Forecast Number Crunching
Stock-Markets / Stock Markets 2020 Mar 16, 2020 - 04:49 PM GMTBy: Chris_Vermeulen

 This is one of those articles that are packed with resources showing your what to expect for various assets both long-term and short-term and will guide you through these volatile times and this year.
Our friends and followers continue to contact us asking what to expect and what should they be doing with their assets and trades? Our research and analysis have been very clear up to this point; we warned of a Zombie Rally in early November and early December 2019, we warned that Oil would fall below $40 on November 15, 2019, and we warned of a global Black Swan event on January 26, 2020.
January 26, 2020: THE BLACK SWAN EVENT BEGINS
December 2, 2019: IS THE CURRENT RALLY A TRUE VALUATION RALLY OR EUPHORIA?
November 15, 2019: WHEN OIL COLLAPSES BELOW $40 WHAT HAPPENS? PART III
November 10, 2019: WELCOME TO THE ZOMBIE-LAND OF INVESTING – PART I
All of this research, in addition to our other research, was very clear that we believed the upside price rally that began in September/October 2019 was a “Zombie-like” price advance that didn’t have a supporting fundamental or technical foundation. We were warning clients and followers to use this advance as a means to move away from risk and into more of a cash position – in preparation for a future event that we believed was setting up. One of the clearest examples of our research team attempting to prepare our followers for what we expected in early 2020 was this post.
December 20, 2019: WHO SAID TRADERS AND INVESTOR ARE EMOTIONAL RIGHT NOW?
Live from NASDAQ
On Friday I was on TV “live from NASDAQ with TD Ameritrade” talking about the technical breakdown on the charts and what to expect here
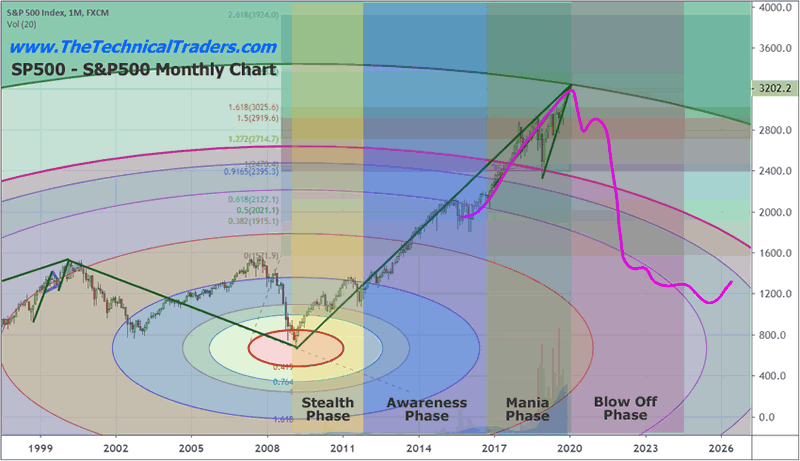
S&P 500 Topping Chart Pattern
This article highlighted our belief that a major topping pattern was set up and that this same price pattern happened just before other major peaks in the US stock market. The Stealth, Awareness, and Mania Phases seemed to be in place – the only thing left was the Blow Off Phase.
This article, today, is going to attempt to share some additional research data developed by our team to help you better understand the potential future outcome of this unfolding event. As with anything we share related to making future price predictions or analysis, this is all based on our research team’s understanding of various global economic fundamentals and expectations related to capital functions throughout the global economic environment.
Be sure to opt-in to our free market trend signals before closing this page, so you don’t miss our next special report!
Let’s get started…
FED Fund Rate & Expectations
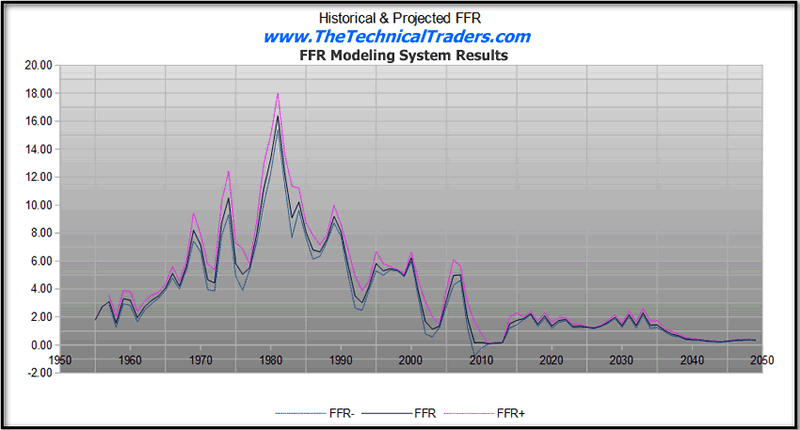
First, we want to share with you our modeling of the US economy and the Fed Funds Rate Optimal Levels which will assist all of us in understanding the future expectations and actions by the US Fed related to future economic modeling. This chart, created by our research team in early 2018, attempts to model the optimal US Fed Funds Rate (FFR) levels based on a decline in population and GDP while US Deficits also decline moderately after 2020 – in other words, more of the same type of global economic functions.
If the Covid-19 virus pushes the GDP lower while government expenses increase and consumer spending/activity decreases, we believe this model is most likely a proper representation of what to expect by the US Fed going forward. As you can see, this modeling system draws an expected FFR level in BLUE, a high variance level in PINK and a low variance level in GREY/TURQUOISE. After the near-zero rates after the 2008-09 credit crisis, our model expected the Fed to begin raising rates in 2013 and for rates to peak near 2017. We believe the US Fed was behind the curve in their actions to adjust the FFR levels throughout most of the past 8+ years. Although, The US Fed has positioned current rates very near to where our predictive modeling system expects for 2020; between 1.25~1.50%.
The future of this model suggests the US Fed will normalize rates near 1.0% as early as 2022 or 2023 and keep rates near 1.0% until sometime near 2027 or so. This model suggests a substantial advance in the US stock market may take place sometime between 2022 and 2028 – before it appears the US Fed will have to address another type of crisis event in near late 2028, or 2029, or early 2030.
How this chart plays into the current Covid-19 expectations is simple, the US Fed will have to attempt to lower rates while stimulating the US and global economies in conjunction with other Central Banks. This modeling system does not take into consideration a pandemic event or other type of Black Swan event. It does take into consideration modeled optimal levels based on a decrease in population, a decrease in GDP and an increase in US Deficits.
Concluding Thoughts:
The point of this article is to share some of our data and our future expectations with you, our friends and followers. As we continue to post additional sections/parts of this article, we’ll dig deeper into our research and forward expectations. Remember, we’ve just highlighted two charts that show potential global economic expectations well into and past 2030. We’ve also shared some predictive modeling that suggests a period between 2021~22 and 2027 should be relatively calm and trendy (likely Bullish) for the US markets. Keep this in mind as we continue our future article posts.
The type of market condition I think we have entered could be here for a while, a year or three, and it’s going to be a traders market, which means you must have a trading strategy, plan your trades, and trade your plan. It’s amazing how simple a few trading rules are written down on paper can save you thousands of dollars a year from locking in gains, or cutting losses. I have this mini trading strategy mastery course if you want to take control of your trades and override your emotional issues. It’s easy to hold winners until they turn into losers, taking to large of a position, or maybe you have masted the art of buying high and selling low repeatedly? Yikes! It happens to most traders, and it can easily be overcome with a logical game plan I cover in the crash course, pun intended ��
In short, if you have lost money with your trading account this year, holding some big losing trades that were big winners just a couple of weeks ago, I think it’s worth joining my trading newsletter so you can stay on top of the markets. I take the loud, emotional, and complex market and deliver simple common sense commentary and a couple of winning trades each month.
My trading is nothing extreme or crazy exciting because I’m not an adrenaline trading junky. I only want to grow my entire portfolio 2-4% a month with a couple of conservative ETF trades. Making 22%-48% return on my capital every year without the stress of being caught up in this type of market, feeling like I always need to be in a trad, and knowing I have a proven bear market trading strategy incase this market continues to fall is crucial for capital preservation, and my health.
As a technical analysis and trader since 1997, I have been through a few bull/bear market cycles. I believe I have a good pulse on the market and timing key turning points for short-term swing traders.
Visit my ETF Wealth Building Newsletter and if you like what I offer, and ride my coattails as I navigate these financial markets and build wealth while others lose nearly everything they own during the next financial crisis.
Chris Vermeulen
www.TheTechnicalTraders.com
Chris Vermeulen has been involved in the markets since 1997 and is the founder of Technical Traders Ltd. He is an internationally recognized technical analyst, trader, and is the author of the book: 7 Steps to Win With Logic
Through years of research, trading and helping individual traders around the world. He learned that many traders have great trading ideas, but they lack one thing, they struggle to execute trades in a systematic way for consistent results. Chris helps educate traders with a three-hour video course that can change your trading results for the better.
His mission is to help his clients boost their trading performance while reducing market exposure and portfolio volatility.
He is a regular speaker on HoweStreet.com, and the FinancialSurvivorNetwork radio shows. Chris was also featured on the cover of AmalgaTrader Magazine, and contributes articles to several leading financial hubs like MarketOracle.co.uk
Disclaimer: Nothing in this report should be construed as a solicitation to buy or sell any securities mentioned. Technical Traders Ltd., its owners and the author of this report are not registered broker-dealers or financial advisors. Before investing in any securities, you should consult with your financial advisor and a registered broker-dealer. Never make an investment based solely on what you read in an online or printed report, including this report, especially if the investment involves a small, thinly-traded company that isn’t well known. Technical Traders Ltd. and the author of this report has been paid by Cardiff Energy Corp. In addition, the author owns shares of Cardiff Energy Corp. and would also benefit from volume and price appreciation of its stock. The information provided here within should not be construed as a financial analysis but rather as an advertisement. The author’s views and opinions regarding the companies featured in reports are his own views and are based on information that he has researched independently and has received, which the author assumes to be reliable. Technical Traders Ltd. and the author of this report do not guarantee the accuracy, completeness, or usefulness of any content of this report, nor its fitness for any particular purpose. Lastly, the author does not guarantee that any of the companies mentioned in the reports will perform as expected, and any comparisons made to other companies may not be valid or come into effect.
Chris Vermeulen Archive |
© 2005-2022 http://www.MarketOracle.co.uk - The Market Oracle is a FREE Daily Financial Markets Analysis & Forecasting online publication.