


Bitcoin Price Trades Like the S&P 500, and is Testing Resistance
Currencies / Bitcoin May 07, 2020 - 03:48 PM GMTBy: Chris_Vermeulen

If you pay attention to the trends taking place on the Weekly Bitcoin chart, you’ll notice that it has reacted to the global market Covid-19 trends almost exclusively since the beginning of 2020. After the end of 2019, the US stock market rallied on Q4: 2019 data and so did Bitcoin. The US Stock market peaked near February 20 and began a deeper selloff on February 25 – Bitcoin followed this pattern as well. When the US Fed initiated the stimulus on March 23, Bitcoin prices had already started to bottom in anticipation of the Fed stimulus and really began to rally after the Fed began intervening.
Before you continue, be sure to opt-in to our free market trend signals before closing this page, so you don’t miss our next special report!
Bitcoin VS S&P 500 Daily Chart Comparison
This is a bit unusual for Bitcoin, which in the past didn’t correlate to the US stock market trends all that well. What changed? We believe the sudden correlation of Bitcoin to the US Stock Market trends are related to investor psychology and the perceived efforts of the Central Banks in supporting the global economy.
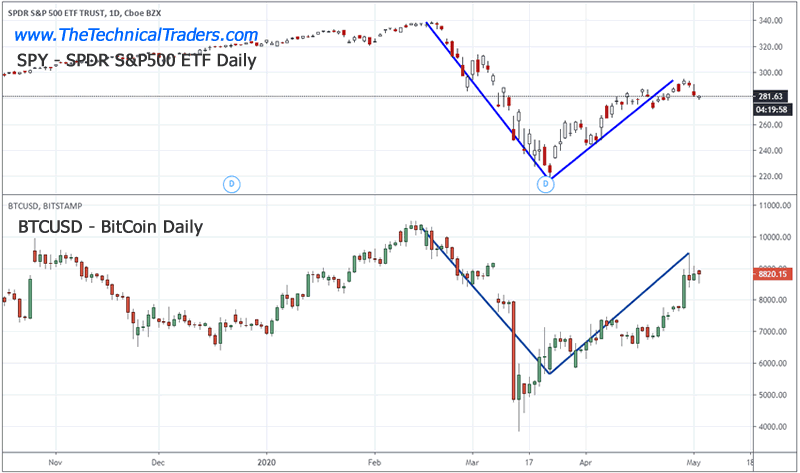
We find it interesting that a decentralized cryptocurrency, which is supposed to be independent of global central banks and governments, suddenly aligns almost perfectly with the US stock market in correlation with the US Federal Reserve. It is almost as if Bitcoin prices are much more aligned with the global economy and global central banks as this crisis event unfolds. This suggests the true value of Bitcoin is not as an alternate, decentralized currency. The true value of Bitcoin is a hyper-speculative alternate store of value – unrelated to any real asset or oversight process.
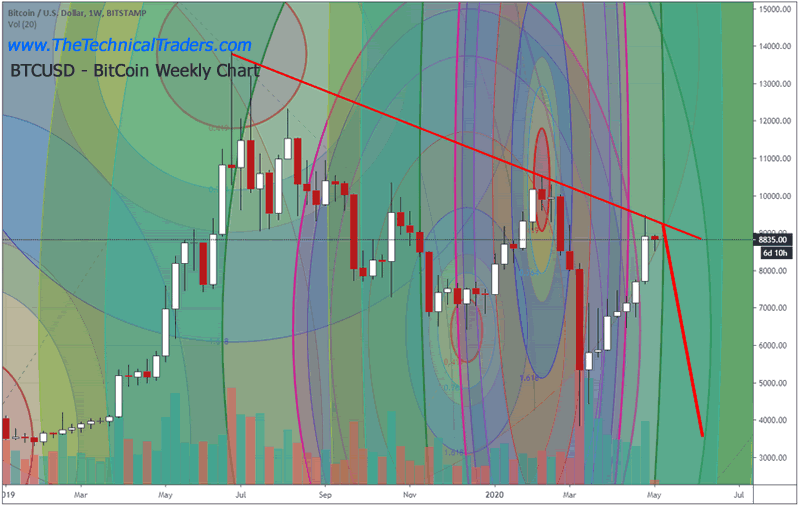
What’s Next for Bitcoin – Weekly Chart
If our research is correct, the current downside price channel (Resistance) originating from the June 2019 highs will prompt a massive breakdown in price over the next 5+ weeks – possibly longer. There are two key factors that lead us to this conclusion. First, the correlation to the US stock market, which we believe will continue to move lower until an ultimate bottom is reached near July or August 2020. Second, the massive Fibonacci Price Amplitude Arc inflection point (the GREEN ARC) which will be reached in less than seven days.
If Bitcoin continues to mirror the US stock market price action and this inflection point does what we believe, then a massive breakdown in price may start to trend sometime between May 8 and May 14.
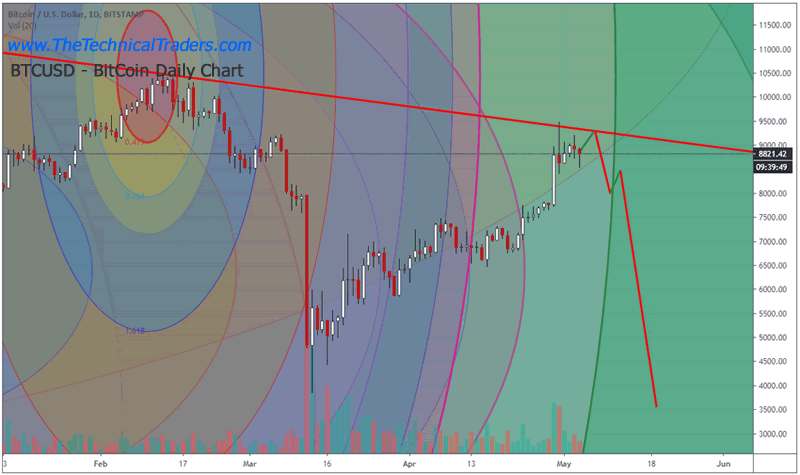
Daily Bitcoin Chart
This Daily Bitcoin Chart shows you what we believe to be the most likely outcome going forward. A bit of upward price rotation to potentially retest the resistance level, then a moderate selloff, followed by a brief sideways trend before an even deeper selloff begins. This may be a map of what the US stock market may do over the exact same span of time.
CONCLUDING THOUGHTS:
Our researchers believe the ultimate bottom will set up near the end of Q3: 2020. We believe general weakness will push the US stock market price towards an ultimate low/bottom near July or August 2020. After that bottom completes, Q4: 2020 may see a moderate upside price trend as the Santa Rally mode kicks in. If Bitcoin mirrors this move, then it may attempt to move below the $3850 level and ultimately attempt to find a bottom below $3000.
Our researchers believe Bitcoin has recently aligned with the US stock market and the global central banks. If this is the case, then the “alternate decentralized currency” aspect of cryptos becomes a useless component of the market. If Bitcoin mirrors the SPY going forward, then it is just an expensive, highly volatile alternate measure of the US stock market and global central bank activities.
Watch for the price breakdown near May 10th or so.
As a technical analyst and trader since 1997, I have been through a few bull/bear market cycles in stocks and commodities. I believe I have a good pulse on the market and timing key turning points for investing and short-term swing traders. 2020 is an incredible year for traders and investors. Don’t miss all the incredible trends and trade setups.
Subscribers of my Active ETF Swing Trading Newsletter had our trading accounts close at a new high watermark. We not only exited the equities market as it started to roll over in February, but we profited from the sell-off in a very controlled way with TLT bonds for a 20% gain. This week we closed out SPY ETF trade taking advantage of this bounce and entered a new trade with our account is at another all-time high value.
Ride my coattails as I navigate these financial markets and build wealth while others watch most of their retirement funds drop 35-65% during the next financial crisis.
Just think of this for a minute. While most of us have active trading accounts, what is even more important are our long-term investment and retirement accounts. Why? Because they are, in most cases, our largest store of wealth other than our homes, and if they are not protected during the next bear market, you could lose 25-50% or more of your net worth. The good news is we can preserve and even grow our long term capital when things get ugly like they are now and ill show you how and one of the best trades is one your financial advisor will never let you do because they do not make money from the trade/position.
If you have any type of retirement account and are looking for signals when to own equities, bonds, or cash, be sure to become a member of my Passive Long-Term ETF Investing Signals which we issued a new signal for subscribers.
Chris Vermeulen
www.TheTechnicalTraders.com
Chris Vermeulen has been involved in the markets since 1997 and is the founder of Technical Traders Ltd. He is an internationally recognized technical analyst, trader, and is the author of the book: 7 Steps to Win With Logic
Through years of research, trading and helping individual traders around the world. He learned that many traders have great trading ideas, but they lack one thing, they struggle to execute trades in a systematic way for consistent results. Chris helps educate traders with a three-hour video course that can change your trading results for the better.
His mission is to help his clients boost their trading performance while reducing market exposure and portfolio volatility.
He is a regular speaker on HoweStreet.com, and the FinancialSurvivorNetwork radio shows. Chris was also featured on the cover of AmalgaTrader Magazine, and contributes articles to several leading financial hubs like MarketOracle.co.uk
Disclaimer: Nothing in this report should be construed as a solicitation to buy or sell any securities mentioned. Technical Traders Ltd., its owners and the author of this report are not registered broker-dealers or financial advisors. Before investing in any securities, you should consult with your financial advisor and a registered broker-dealer. Never make an investment based solely on what you read in an online or printed report, including this report, especially if the investment involves a small, thinly-traded company that isn’t well known. Technical Traders Ltd. and the author of this report has been paid by Cardiff Energy Corp. In addition, the author owns shares of Cardiff Energy Corp. and would also benefit from volume and price appreciation of its stock. The information provided here within should not be construed as a financial analysis but rather as an advertisement. The author’s views and opinions regarding the companies featured in reports are his own views and are based on information that he has researched independently and has received, which the author assumes to be reliable. Technical Traders Ltd. and the author of this report do not guarantee the accuracy, completeness, or usefulness of any content of this report, nor its fitness for any particular purpose. Lastly, the author does not guarantee that any of the companies mentioned in the reports will perform as expected, and any comparisons made to other companies may not be valid or come into effect.
Chris Vermeulen Archive |
© 2005-2022 http://www.MarketOracle.co.uk - The Market Oracle is a FREE Daily Financial Markets Analysis & Forecasting online publication.