


US STOCK MARKET Custom Index Charts Show Clear Bullish Trending
Stock-Markets / Stock Markets 2020 Dec 10, 2020 - 02:06 PM GMTBy: Chris_Vermeulen

My research team and I have created Custom Index charts that highlight the continued upside/bullish trend that is taking place in the US stock markets. We continued to stay moderately cautious in late October and early November because of the extensive price rotation at that time and because of the US election event. The dramatic rally in the US markets that started before the US elections prompted our research team to pause and evaluate how must risk was being ignored by the upside price rally. Initially, we discounted the rally as a speculative move in the market – likely to end badly and quickly.
Now, after our Custom Index charts have established moderate momentum signals and what appears to be a very solid global market influx of capital into various US market sectors, we believe this rally may still have some legs behind it.
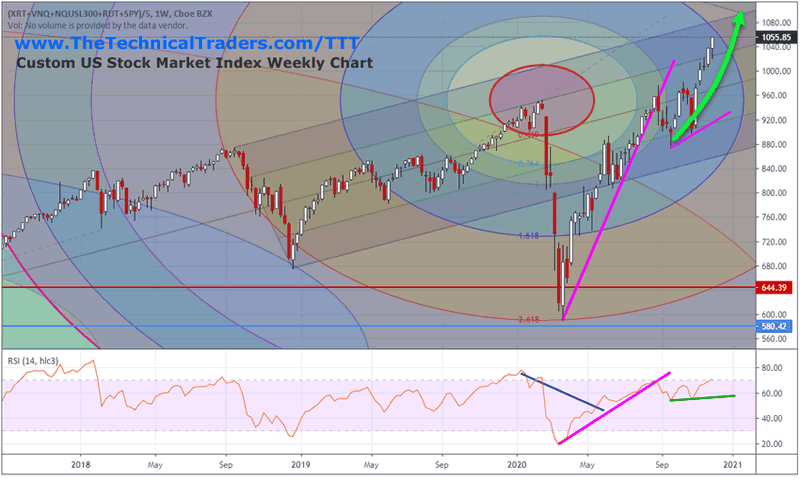
CUSTOM US STOCK MARKET INDEX CHART
My team has described this rally in the following terms:
“Forward expectations after the US elections as well as foreign market capital participation in various undervalued US sectors appears to be focused on the Small and Mid Cap sectors. Various other sectors, like Technology, Healthcare, Financials and Energy, appear to be strengthening as well”.
Investors may be pushing their capital into sectors that support a “green transition” into cleaner energy as well as sectors that may benefit from US government stimulus and policy (infrastructure) efforts over the next 24+ months. From the looks of the data/charts, it appears investors completely believe the opportunities within these sectors are still very valid and that these sectors may be dramatically undervalued. The next big rally in the US markets may be to watch these sectors recover to new all-time highs.”
Be sure to sign up for our free market trend analysis and signals now so you don’t miss our next special report!
The rally in the Custom US Stock Market Index chart below highlights the upside breakout just 2 weeks ago and the continued upside momentum that is tracking to push the US markets another 4 to 8% higher. Longer term, our researchers believe a 13% to 15% could be just starting after the US elections.
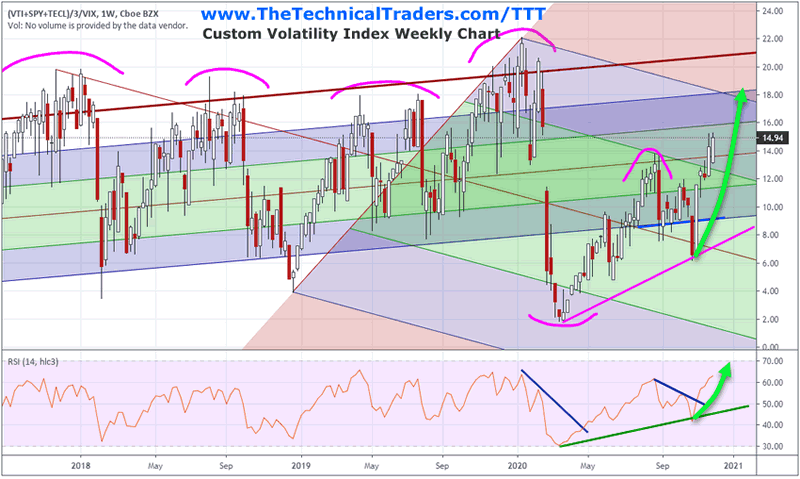
CUSTOM VOLATILITY INDEX CHART
We believe the current upside price trend represents global investors putting their capital to work in the US markets and targeting sectors that are currently undervalued. We witnessed a massive move to cash in the months before the US elections and it appears that capital is now deploying into the US markets in sectors that have continued to stay under some valuation pressure.
Overall, if the US stock markets continue to rally back toward normal volatility levels on our Custom Index chart, below, we may experience a 30% to 35% rally in the Volatility Index – which we believe would equate to a 9% to 15% rally in the US stock market over time.
We believe the technical confirmation of this upside rally trend has now confirmed and that traders should start engaging with this rally in a more aggressive form. We certainly believe risks are still elevated at this time – but we have to follow the capital in regards to where global investors are pushing their investments. The opportunities are there for the markets to continue to rally well into 2021 as new government stimulus and policy continue to drive strong sectoral growth.
As we move towards 2021, pay attention to how the markets react to the continued recovery efforts and global banking/policy issues. A variety of sectors could become a very profitable sector for traders. We can help you find and identify great trading opportunities so visit www.TheTechnicalTraders.com to learn about my exciting ”Best Asset Now” strategy and indicators. Sign up for my daily pre-market video reports that walk you through the charts of all the major asset classes every morning.
Chris Vermeulen
www.TheTechnicalTraders.com
Chris Vermeulen has been involved in the markets since 1997 and is the founder of Technical Traders Ltd. He is an internationally recognized technical analyst, trader, and is the author of the book: 7 Steps to Win With Logic
Through years of research, trading and helping individual traders around the world. He learned that many traders have great trading ideas, but they lack one thing, they struggle to execute trades in a systematic way for consistent results. Chris helps educate traders with a three-hour video course that can change your trading results for the better.
His mission is to help his clients boost their trading performance while reducing market exposure and portfolio volatility.
He is a regular speaker on HoweStreet.com, and the FinancialSurvivorNetwork radio shows. Chris was also featured on the cover of AmalgaTrader Magazine, and contributes articles to several leading financial hubs like MarketOracle.co.uk
Disclaimer: Nothing in this report should be construed as a solicitation to buy or sell any securities mentioned. Technical Traders Ltd., its owners and the author of this report are not registered broker-dealers or financial advisors. Before investing in any securities, you should consult with your financial advisor and a registered broker-dealer. Never make an investment based solely on what you read in an online or printed report, including this report, especially if the investment involves a small, thinly-traded company that isn’t well known. Technical Traders Ltd. and the author of this report has been paid by Cardiff Energy Corp. In addition, the author owns shares of Cardiff Energy Corp. and would also benefit from volume and price appreciation of its stock. The information provided here within should not be construed as a financial analysis but rather as an advertisement. The author’s views and opinions regarding the companies featured in reports are his own views and are based on information that he has researched independently and has received, which the author assumes to be reliable. Technical Traders Ltd. and the author of this report do not guarantee the accuracy, completeness, or usefulness of any content of this report, nor its fitness for any particular purpose. Lastly, the author does not guarantee that any of the companies mentioned in the reports will perform as expected, and any comparisons made to other companies may not be valid or come into effect.
Chris Vermeulen Archive |
© 2005-2022 http://www.MarketOracle.co.uk - The Market Oracle is a FREE Daily Financial Markets Analysis & Forecasting online publication.