


Stock Market Pushing Higher
Stock-Markets / Stock Market 2021 Apr 06, 2021 - 04:43 PM GMTBy: Andre_Gratian

Current Position of the Market
SPX Long-term trend: There is some evidence that we are still in the bull market which started in 2009 and which could continue into the first half of 2021 before major cycles take over and it comes to an end.
SPX Intermediate trend: SPX is starting on the next phase of its intermediate uptrend.
Analysis of the short-term trend is done daily with the help of hourly charts. They are important adjuncts to the analysis of daily and weekly charts which determine longer market trends.
Pushing Higher
Cycles: Looking ahead!
90-yr cycle – Last lows: 1843-1933. Next low: ~2023
40-yr cycle -- Last lows: 1942 -1982. Next low: ~2022
7-yr cycle – Last lows: 2009-2016. Next low: ~2023
Market Analysis (Charts, courtesy of QCharts)
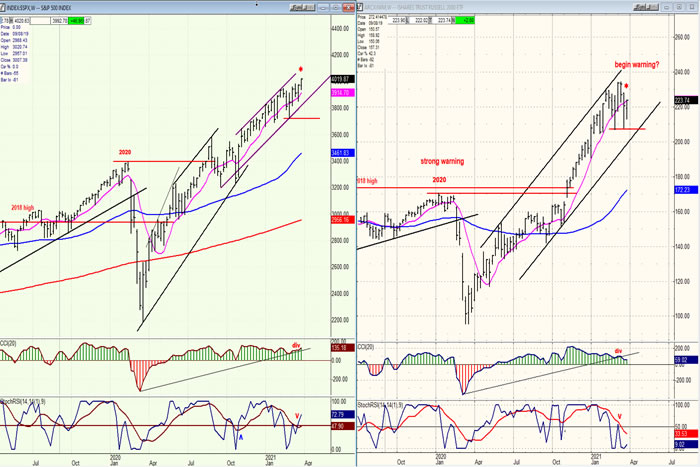
SPX vs. IWM
SPX ended the week at a new all-time high, on its way to the 4100-4150 target mentioned in last week’s newsletter. So, the bullish trend continues, but this should not obscure the fact that we are getting close to the end of the move which started in 2009, both in terms of price and time.
Based on the pattern created at the March low, we have several projections which could determine the final high, all the way to a potential extreme of 4400+, but we should be aware that this is, at best, an approximation of what the last tick will turn out to be and we will let the market decide at what point it wants to reverse.
It has been a few weeks since we posted the following charts. During that time, changes have occurred which have altered the relative strength between IWM and SPX. For the past three weeks, IWM has been relatively weaker than SPX. This should not cause immediate concern about the stock market; but if it persists, we will want to see if this warning spreads to more sensitive indicators.
We know that time-proven major cycles are due to make their lows in the not-too-distant future and it is therefore only a matter of time before they start interfering with the bullish trend.
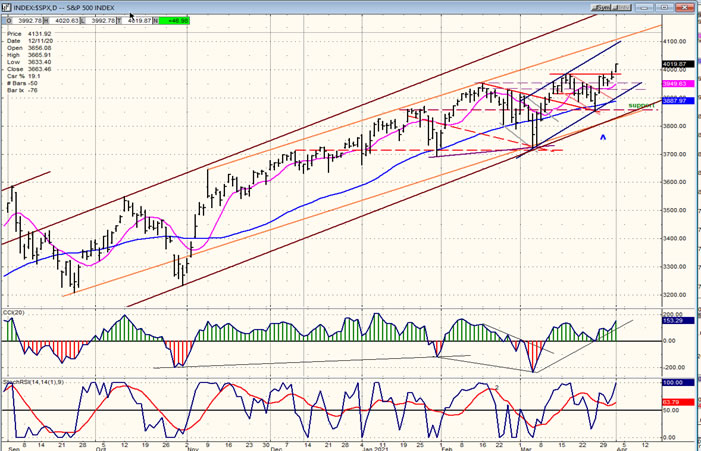
SPX daily chart
On Thursday, SPX overcame the resistance which had delayed its move to a new all-time high and closed at 4019.87. As the chart shows, this is bullish for the short term as it extends the uptrend from last week’s low of 3853 and begins to confirm the possibility also discussed in last week’s letter that this could be the beginning of the next bullish phase from the 3723 low. It is also bullish for the intermediate term because it continues the trend which started at 3234 after an intermediate correction which lasted two months.
The correction which took place from the 3950 high to the 3723 low is far more important than it appears on an SPX bar chart. On a P&F chart, that time span has created a pattern which confirms the projections established at the March low. The nearest projection suggests that the move which is starting can continue to 4100 and above before it ends. Should it come to fruition, it would most likely delineate phase three of the move from 3723 -- although the latter could even move higher before it is complete.
The oscillators are also bullish. The minor pullback down to 3853 only managed to bring the CCI down to the zero line, and it did not go negative. Since then, that indicator also closed at a new high on Thursday while SRSI has already risen to 100%. This is bullish and strongly suggests that higher prices lie ahead.
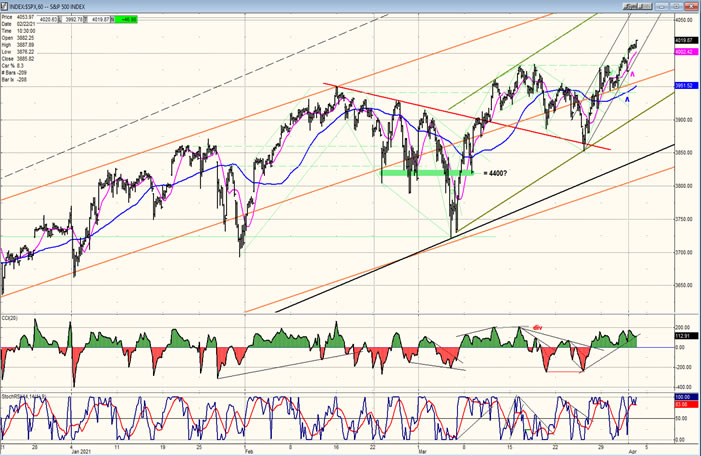
SPX hourly chart
There is a lot of information contained in the hourly chart below! I’ll try to make it as clear as possible.
A new intermediate trend started on 10/30/20 from 3234. The initial upthrust was immediate and powerful, taking the index to 3646 before ending (see the daily chart, above). After that, the index started a succession of higher highs and higher lows which enabled us to draw the upper set of orange channel lines. The price essentially remained confined to these channel lines until it reached 3950. At that point, a correction occurred which took SPX down to 3723, doubling the breadth of the orange channel. This also created a new (black) longer-term channel which will be discussed in more detail in future analyses when it becomes more relevant. For now, be aware that the top line of that black channel is shown on the chart as a dashed line.
Before we go on with the chart analysis, note that I have drawn a thick green trend line at the 3820 level. This represents the potential upside count which was formed by the congestion which took place on the P&F chart, and it gives us a projection to ~4400. But it can be broken down into phases which will be helpful in our gauging the various trends in the index as it progresses toward the potential ~4400 objective.
The move from 3723 to 3981 was clearly one, continuous up-phase. The next (corrective) down-phase took the index down to 3853 which, when touched, prompted a sharp upward reversal, with the index continuing until it reached the former high. After a brief pullback, the trend started up again and, by Thursday’s close, had made the new all-time high of 4019.87.
If my P&F interpretation is correct, this move should progress to 4100-4150 before the next consolidation takes place. That could take us outside of the orange channel and to the top of the black channel before the move ends. Even then, this would leave us potentially some 200+ points shy of the entire rally projection before we should become concerned about a bull market top.
-
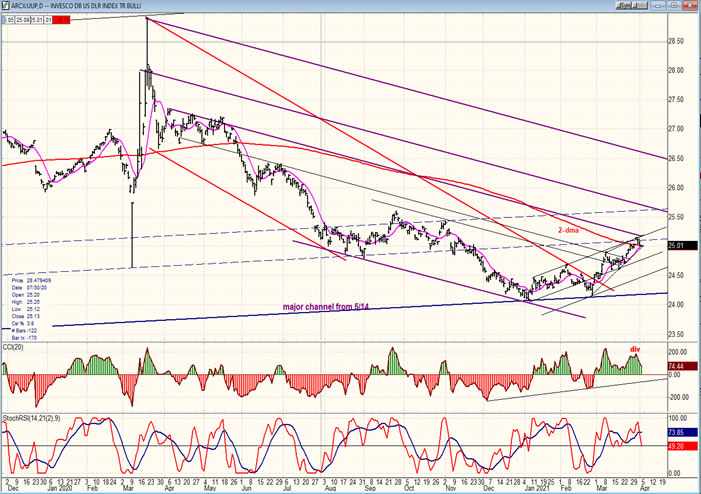
- UUP (dollar ETF) DLY ($USD chart is not available from this data provider)
- UUP has probably met a short-term top in conjunction with its 200-dma. This has temporarily arrested the uptrend which also met a resistance line, but it is likely only a short-term top and, after some consolidation, the index could progress to the next higher purple parallel. Although there was negative divergence forming in the oscillators, they have not given a sell signal and would have to become negative before doing so. For now, I would label this as short-term consolidation.
-
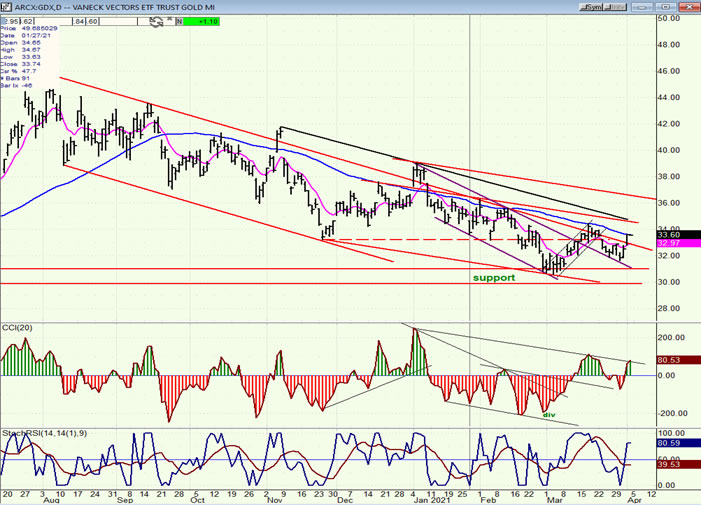
- GDX (gold miners)-DLY
- GDX found a short-term low in connection with a short-term top in UUP and bounced. It does not look capable of doing much more at this time and at the most, it could challenge the top of the red channel around 35.50-36. This should be followed by a pullback and more consolidation.
-
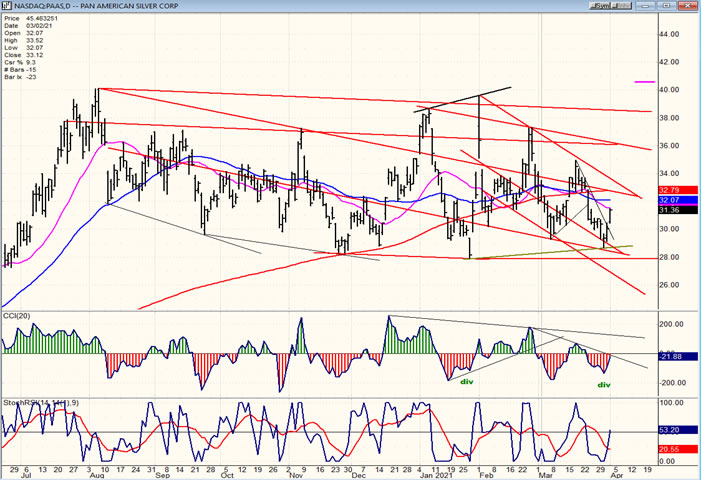
- PAAS (Pan American Silver Corp-DLY)
- Like GDX, PAAS has bounced off its low and, like GDX, appears limited in what it can achieve on the upside over the short term.
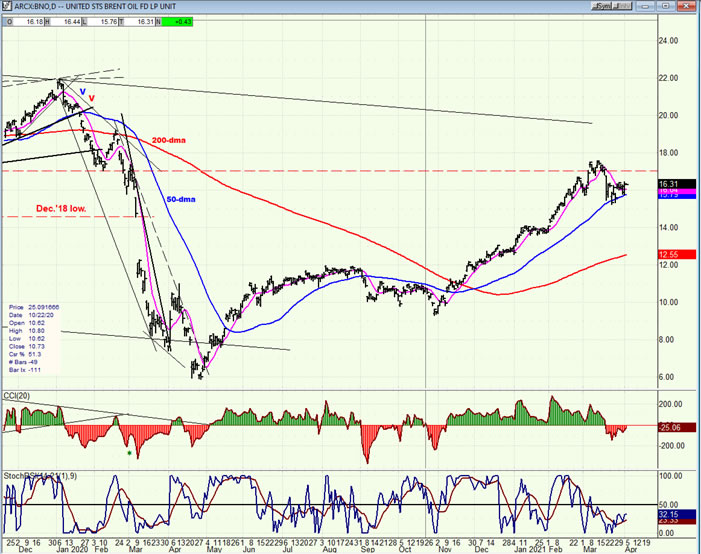
- BNO (Brent oil fund) DLY.
- BNO continues to consolidate after reaching its extreme short-term projection. It may be ready for a bounce to retest the recent high.
-
- SUMMARY
- SPX has started its second up-phase from 3723. This could take it above 4100 before it is ready for more consolidation.
Andre
Free trial subscription
With a trial subscription, you will have access to the same information that is given to paid subscribers, but for a limited time-period. Over the years, I have developed an expertise in P&F charting (price projection), cycles (timing), EWT (structure), and general technical analysis which enables me to warn subscribers of pending reversals in market trends and how far that trend can potentially carry. For a FREE 2-week trial, subscription options and payment plans, I encourage you to visit my website at www.marketurningpoints.com.
Disclaimer - The above comments about the financial markets are based purely on what I consider to be sound technical analysis principles uncompromised by fundamental considerations. They represent my own opinion and are not meant to be construed as trading or investment advice, but are offered as an analytical point of view which might be of interest to those who follow stock market cycles and technical analysis.
Andre Gratian Archive |
© 2005-2022 http://www.MarketOracle.co.uk - The Market Oracle is a FREE Daily Financial Markets Analysis & Forecasting online publication.