


Escaping The United States May Be Leading To An Extreme Market Bubble Setup
Stock-Markets / Financial Markets 2021 Jul 10, 2021 - 07:08 PM GMTBy: Chris_Vermeulen

The past few years have seen housing prices skyrocket as Flippers, Speculators and Traditional Buyers jump into home buying or selling to relocate to different areas throughout the US. One interesting facet of this phenomenon recently hit NBC news over the past few days related to the super hot Boise Idaho and Coeur D’Alene Idaho market. Home prices in the Boise area have skyrocketed higher by over 30% in just 12 months. In Coeur D’Alene, home prices have risen over 85% in the past 12 months.
Is a Supply/Demand Measure Distorted By Recent Buying Activity – And What’s Next?
My concern is that the post-COVID buying/relocating trends have pushed the Supply/Demand pricing factors well past the equilibrium. Simply put, the moratoriums and policies related to home renters and homeowners throughout the COVID-19 crisis have created a supply crisis at a time when many people had the capabilities to sell and relocate into different areas of the US at the same time. Diminishing supply with hyper-active demand pushes price levels upward and to the left, as illustrated on the Supply/Demand chart below.
The data and activity are supporting a hypothesis that speculators, flippers, and homebuyers have chased the rising price levels well past a key equilibrium level suggesting that a reversion process is very likely in the near future. This reversion event may be similar to the 2008-09 housing crisis as banks suddenly realize they’ve issued loans to borrowers at extremely high price levels with very little collateral to support these transactions. Or borrowers suddenly realize they are trapped in an overpriced home while the economy reverts to lower output levels. Either way, this seems like a receipt for some type of crisis in the making.
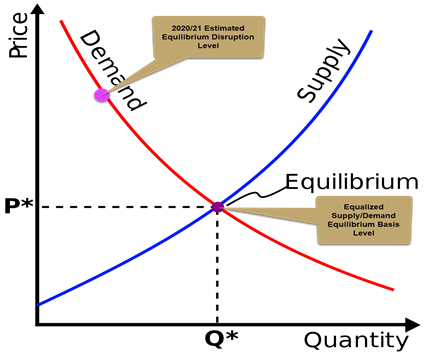
The four basic laws of Supply & Demand are simple to understand. Basically, the market is always seeking to maintain an equilibrium between buyers and sellers based on supply/demand factors. When extreme events take place to disrupt the equilibrium, these events unfold to push prices higher or lower depending on the event type. Eventually, as prices reach an extreme level, buyers and sellers begin to understand the extreme nature of the price disruption and a process of “reverting” will take place.
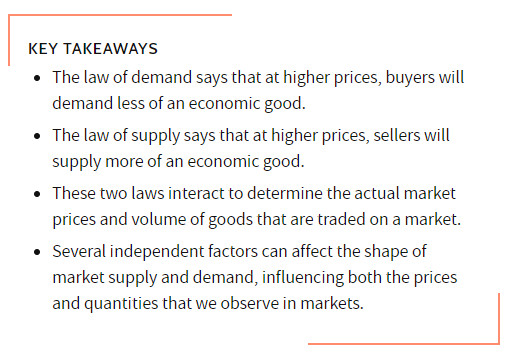
Price is always seeking to establish a proper equilibrium between demand and supply as buyers and sellers negotiate fair price levels for transactions. Once buyers or sellers believe the price levels are extreme, they typically become much more hesitant to engage in transactions because the risks become far too excessive as well. This is known as the Law of Supply and Demand, as seen below from Investopedia.
The biggest factor driving this substantial Boom Cycle is the relocation of people from cities to more rural areas. As COVID-19 hit, a big wave of people suddenly decided to give up their city life and move into more rural areas to avoid close proximity issues. The super low interest rates and the fact that the COVID-19 income disruptions were mostly related to entertainment, retail and restaurant workers prompted those with the capital means to take advantage of somewhat stagnant rural pricing (at the time). Now, about 14+ months later, home prices in these rural areas are rivaling, or beating, price values in some of the most prominent metropolises in the US.
This type of pricing activity throughout mostly rural areas seems very reminiscent of the 2005 to 2008 setup of the markets related to the market meltdown (Housing/Credit crisis) of 2008-09. We are starting to see similarities in the data that may suggest the current Housing Boom Cycle is running on fumes right now (likely driven by speculators, flippers, and super low interest rates). Let’s see what the data is showing us and you can draw your own conclusions.
MBA Purchase Index Data Shows Decidedly Lower Trends
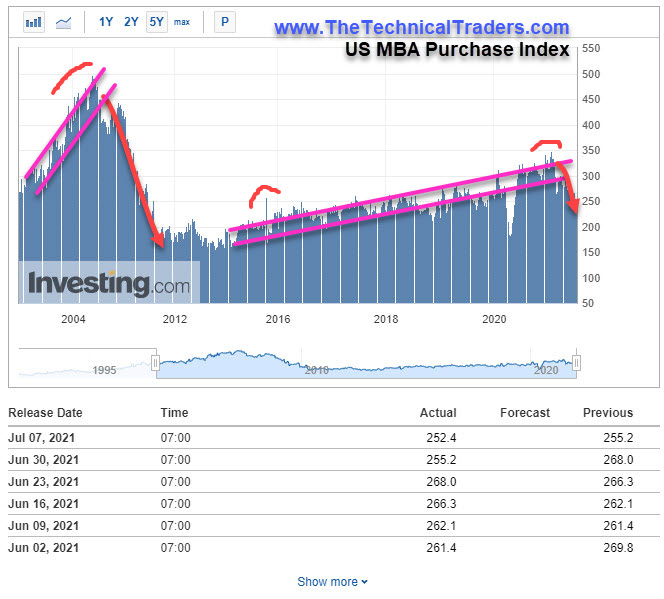
The US MBA Purchase Index includes all mortgage applications related to the purchase of single-family homes – covering both conventional and government loan types, and all products offered. This Index is an excellent indicator of demand and activity related to the total US buying trends.
Since mid February 2021, the MBA Purchase Index has broken downward after reaching what appears to be an Excess Peak in late 2020 and early 2021. My team and I believe this “rollover” in mortgage purchase activity is similar to the 2006~2007 decline in mortgage activity that happened just before the broad market collapse that took place in 2008-09 (see the left side of the US MBA Purchase Index chart below). Even though mortgage activity shown on this chart suggests that activity levels are peaking near 350 and have historically bottomed near 150, an extreme downturn in the current housing market trends could prompt a pullback closer to the 100 level as buyers pull away from a potentially dangerous real estate market price decline (reversion) event. Buyers of big ticket items, such as a house, tend to wait out big downturns – waiting for the best deals.
This downward trend in mortgage purchases aligns with the Supply/Demand theory that buyers are becoming hesitant to chase new purchases at these current extreme levels. Are there other data that point to a broader market slowdown in home sales? Do current price levels properly reflect a sufficient supply/demand equilibrium that allows for continued rising price levels?
In Part II of this article we’ll continue exploring the data related to the current housing market and begin to explore the potential global price event that may unfold over the next few years. One thing is certain from the data we’ve presented so far – it appears the Housing Bubble is starting to stall. What will it take to burst this bubble event and is the US Federal Reserve ready for it?
Be sure to sign up for our free market trend analysis and signals now so you don’t miss our next special report!
Traders want to stay ahead of these trends and opportunities related to what may become the next big disruptive technology gains. As we move further into the 21st Century, it is very likely that space will become the DOT COM/Internet disruptive technology over the next 20 to 40+ years (or longer). That means traders need to start considering how this exciting new sector fits into their investment portfolio and where new industry leaders will settle.
Want to know how our BAN strategy is identifying and ranking various sectors and ETFs for the best possible opportunities for future profits? Please take a minute to learn about my BAN Trader Pro newsletter service and how it can help you identify and trade better sector setups. My team and I have built this strategy to help us identify the strongest and best trade setups in any market sector. Every day, we deliver these setups to our subscribers along with the BAN Trader Pro system trades. You owe it to yourself to see how simple it is to trade 30% to 40% of the time to generate incredible results.
From all my decades of experience, I can tell you that unless you have a solid foundation related to knowing when and where opportunities exist in market trends, you are likely churning your money in and out of failed trades. I will be presenting my two favorite strategies at the July Wealth365 Summit on July 13th at 4 pm and July 16th at 12 pm. The Summit is free to attend and offers unparalleled opportunities for learning…plus a potential prize or two!
Have a great day!
Chris Vermeulen
www.TheTechnicalTraders.com
Chris Vermeulen has been involved in the markets since 1997 and is the founder of Technical Traders Ltd. He is an internationally recognized technical analyst, trader, and is the author of the book: 7 Steps to Win With Logic
Through years of research, trading and helping individual traders around the world. He learned that many traders have great trading ideas, but they lack one thing, they struggle to execute trades in a systematic way for consistent results. Chris helps educate traders with a three-hour video course that can change your trading results for the better.
His mission is to help his clients boost their trading performance while reducing market exposure and portfolio volatility.
He is a regular speaker on HoweStreet.com, and the FinancialSurvivorNetwork radio shows. Chris was also featured on the cover of AmalgaTrader Magazine, and contributes articles to several leading financial hubs like MarketOracle.co.uk
Disclaimer: Nothing in this report should be construed as a solicitation to buy or sell any securities mentioned. Technical Traders Ltd., its owners and the author of this report are not registered broker-dealers or financial advisors. Before investing in any securities, you should consult with your financial advisor and a registered broker-dealer. Never make an investment based solely on what you read in an online or printed report, including this report, especially if the investment involves a small, thinly-traded company that isn’t well known. Technical Traders Ltd. and the author of this report has been paid by Cardiff Energy Corp. In addition, the author owns shares of Cardiff Energy Corp. and would also benefit from volume and price appreciation of its stock. The information provided here within should not be construed as a financial analysis but rather as an advertisement. The author’s views and opinions regarding the companies featured in reports are his own views and are based on information that he has researched independently and has received, which the author assumes to be reliable. Technical Traders Ltd. and the author of this report do not guarantee the accuracy, completeness, or usefulness of any content of this report, nor its fitness for any particular purpose. Lastly, the author does not guarantee that any of the companies mentioned in the reports will perform as expected, and any comparisons made to other companies may not be valid or come into effect.
Chris Vermeulen Archive |
© 2005-2022 http://www.MarketOracle.co.uk - The Market Oracle is a FREE Daily Financial Markets Analysis & Forecasting online publication.