


The Energy Sector Breaks Out!
Commodities / Crude Oil Apr 18, 2007 - 07:00 PM GMTBy: Donald_W_Dony

The recent upward move in the energy indexes signals higher prices can be expected in 2007 and oil will remain firm at current levels. It also shows inflation is still growing and global economies are continuing to expand.
After 10 months of consolidation below the key 1235 resistance level, the Amex Oil Index (Chart 1) has broken out above this important price ceiling. This indicates the main upward trend in the oil sector is now continuing. And as the Amex Oil Index often leads the commodity, it also implies oil prices will remain firm at current levels as the summer driving season draws near.
Technical evidence shows growing upward pressure should continue until the first half of June.
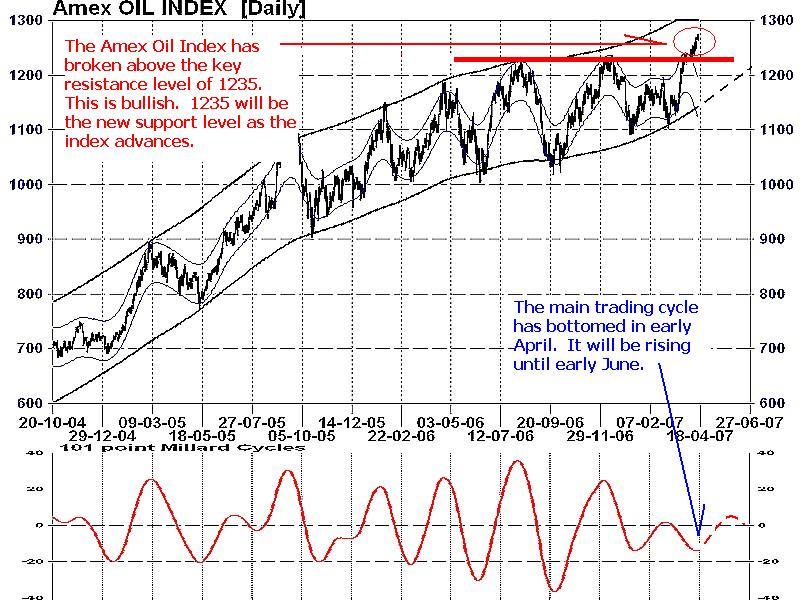
The main 13-week trading cycle (lower portion of Chart 1), which has bottomed in late April, will have rising strength for the next 5-6 weeks. 1235 should offer support on any short-term retracement. The technical target is 1410 by year end.
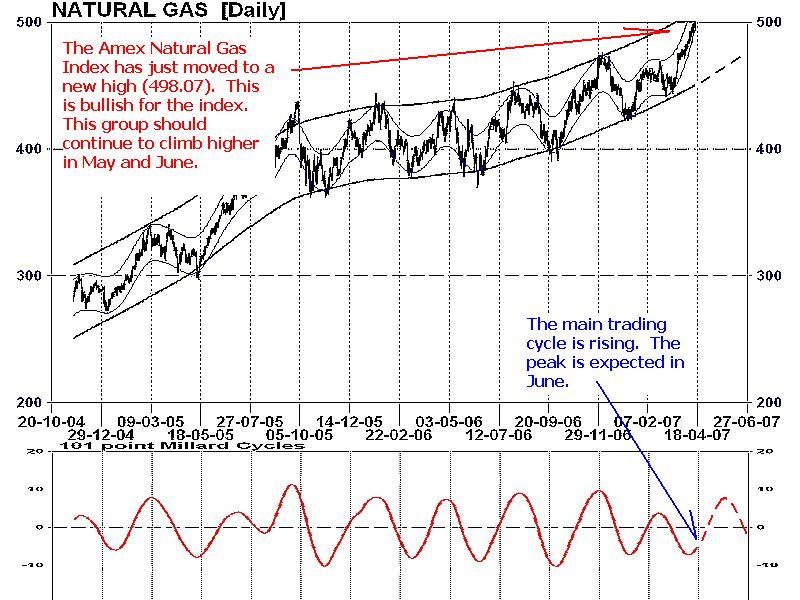
The global demand for a clean energy source has placed ongoing upward pressure on natural gas. This commodity now ranks number one in usage in North America for home and commercial heating. As the hurricane season begins in June, the likelihood of some supply disruptions is highly probable. This will only escalate current pressure on natural gas and related stocks. Historically, this commodity annually peaks in the 4th quarter. Present trading action on the Amex Natural gas Index (Chart 2) suggests the primary upward trend is intact and will be escalating higher in 2007.
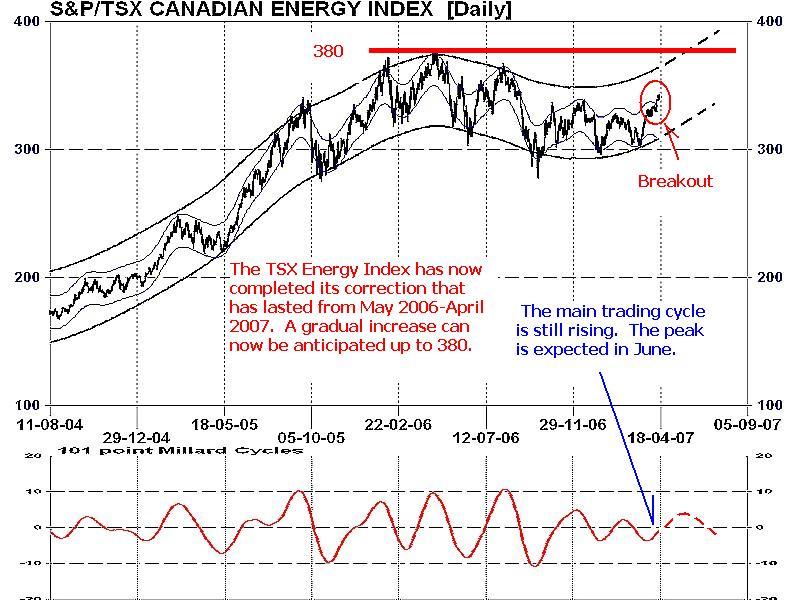
The TSX Energy Index, though not as strong as the Amex Oil Index, is turning positive after 11 months of decline. This bullish change of trading is promising as oil and natural gas are approaching their normally stronger seasonality in the second half of the year.
The TSX Energy Index (Chart 3) also trades on a 13-week cycle. With a low established in the second half of April, the crest is projected to arrive in June. Upward resistance is apparent at the 380 level which should offer a ceiling during the current trading cycle. Long-term, this Index should benefit from improving energy prices and will likely break above the 380 line in the second half of 2007. This is historically the strongest period for commodities.
INTERMARKET PERSPECTIVE: The returning increases in most commodity prices over the last few months strongly suggest economies are expanding and not cooling, and inflation is growing again. This market development will eventually apply upward pressure to interest rates in the second half of 2007. Higher energy prices will dampen the general stock markets performance and current upward trend but this action normally takes months to materialize.
MY CONCLUSION: As energy sectors usually lead the commodities, the present strength in the Amex Oil and Natural Gas Indexes along with returning vitality of the TSX Energy Index points to gradually improving energy markets in 2007. Historically, the second half of each year offers improved performance for the energy sectors over the first half. Summer driving and air conditioning power demands, expectations of winter heating and the probability of supply disruptions from hurricanes normally all contribute to a higher energy prices over the next six months.
More detailed information on commodities and the economy can be found in the April newsletter. Also two pages of timing stock recommendations focusing on the escalating energy markets.
Your comments are always welcomed.
By Donald W. Dony, FCSI, MFTA
www.technicalspeculator.com
COPYRIGHT © 2007 Donald W. Dony
Donald W. Dony, FCSI, MFTA has been in the investment profession for over 20 years, first as a stock broker in the mid 1980's and then as the principal of D. W. Dony and Associates Inc., a financial consulting firm to present. He is the editor and publisher of the Technical Speculator, a monthly international investment newsletter, which specializes in major world equity markets, currencies, bonds and interest rates as well as the precious metals markets.
Donald is also an instructor for the Canadian Securities Institute (CSI). He is often called upon to design technical analysis training programs and to provide teaching to industry professionals on technical analysis at many of Canada's leading brokerage firms. He is a respected specialist in the area of intermarket and cycle analysis and a frequent speaker at investment conferences.
Mr. Dony is a member of the Canadian Society of Technical Analysts (CSTA) and the International Federation of Technical Analysts (IFTA).
© 2005-2022 http://www.MarketOracle.co.uk - The Market Oracle is a FREE Daily Financial Markets Analysis & Forecasting online publication.