


Uranium Stocks Remain in Deep Sleep
Commodities / Uranium Jan 28, 2009 - 12:42 PM GMTBy: Merv_Burak

 Boy, this is one frustrating market. The uranium stocks just seem to be trapped in a deep sleep and are hesitant to wake up. I guess that is still preferred seeing as how the spot price of uranium U308 dropped $3.00 this week. Going by that we are still lucky that the stocks have not plunged.
The Merv's Daily Uranium Index gained all of 0.39 points or 0.28% today. There were 18 winners, 25 losers and 7 going nowhere. The overall market seemed to be on the down side despite the slight Index gain. That's probably due to the moves of the larger stocks which closed mostly higher. Cameco gained 1.0%, Paladin gained 3.3%, Uranium One lost 3.4%, Uranium Participation gained 1.7% and USEC lost 2.3%. The best winner on the day was Uranium Power with a 26.7% win while the loser on the day was Energy Fuels with a loss of 25.8%.
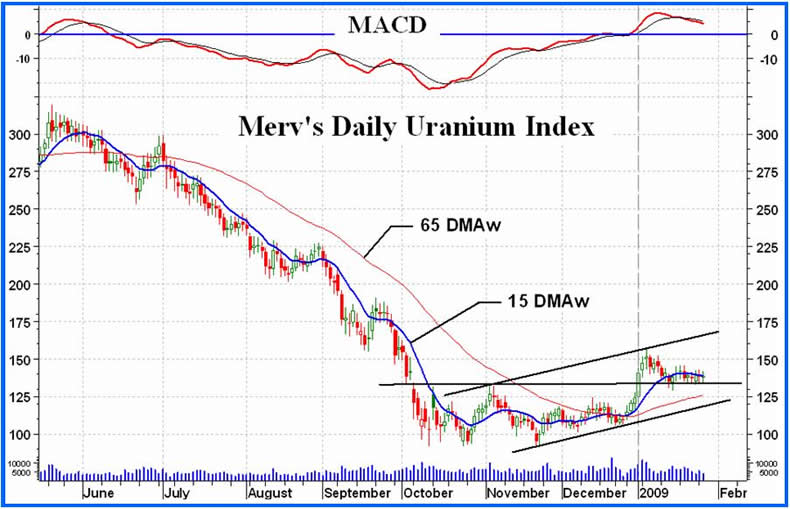
The momentum shown today is that of the Moving Average Convergence/Divergence (MACD) indicator. It is probably the most popular momentum type indicator with non-technicians as well as technicians. The parameters of this indicator are fixed. When used with a daily chart I would classify it as in between a short and an intermediate term indicator. I have my problems with it but many like it so I show it from time to time just to cut out the monotony. My analysis still is relative to the RSI momentum indicators as I can change the parameters to give me momentum indicators relative to any time period.
Well, let's forget what looked like a pennant pattern as it is now null and void. The dominant features of the daily chart are still the support line from the previous “box” and the up trending channel. Both are holding their own for now. With the miniscule activity today nothing has yet changed in the indicators or ratings. The intermediate term rating remains + NEUTRAL and the short term BEARISH . See the week-end analysis for a more complete review of their positions, they have not changed since.
As for the immediate direction of least resistance, well as you might have guessed that remains to the lateral, where the action has been trending for some days now.
By Merv Burak, CMT
Hudson Aero/Systems Inc.
Technical Information Group
for Technically Uranium with Merv
Web: http://techuranium.blogspot.com/
e-mail: merv@themarkettraders.com
During the day Merv practices his engineering profession as a Consulting Aerospace Engineer. Once the sun goes down and night descends upon the earth Merv dons his other hat as a Chartered Market Technician ( CMT ) and tries to decipher what's going on in the securities markets. As an underground surveyor in the gold mines of Canada 's Northwest Territories in his youth, Merv has a soft spot for the gold industry and has developed several Gold Indices reflecting different aspects of the industry. As a basically lazy individual Merv's driving focus is to KEEP IT SIMPLE .
This Blog is - A periodic review of the daily or weekly market action in uranium stocks. The review is strictly from the technical perspective. Merv is a pure market technician. Weekly, one will find a table of technical information and ratings of the 50 component stocks of the Merv's Uranium Index as well as a weekly summary of the uranium stock activity. Daily (most days), one will find a daily review of the market action of the Merv's Daily Uranium Index as well as technical analysis of one or more uranium stocks of interest.
Disclaimer - Technical analysis is not perfect. Should you expect perfection this is not the site for you.
Technical analysis IS a very sound technique to assess the daily or weekly trading activities in securities and to assess appropriate timing of investment activities. This blog provides such technical analysis of the trading activity in uranium stocks for your information. Any use made of this information is strictly at the users risk. No guarantees are made for the accuracy or potential for the information provided herein. Use at your own risk. You are strongly advised to check with your broker or investment adviser before activating any investment desisions.
Merv Burak Archive |
© 2005-2022 http://www.MarketOracle.co.uk - The Market Oracle is a FREE Daily Financial Markets Analysis & Forecasting online publication.