


Gold Bull Market Low Risk Buying Opportunity
Commodities / Gold & Silver 2009 Mar 05, 2009 - 03:12 AM GMTBy: Chris_Vermeulen

 Gold and gold stocks have had a nice controlled correction over the past 9 days. We look to be nearing the bottom of the bull trend channel, which could be a great buy point. If gold has a reversal around this level, then it would make for a low risk buy signal. But there is one issue, which really concerns me, which I will explain later.
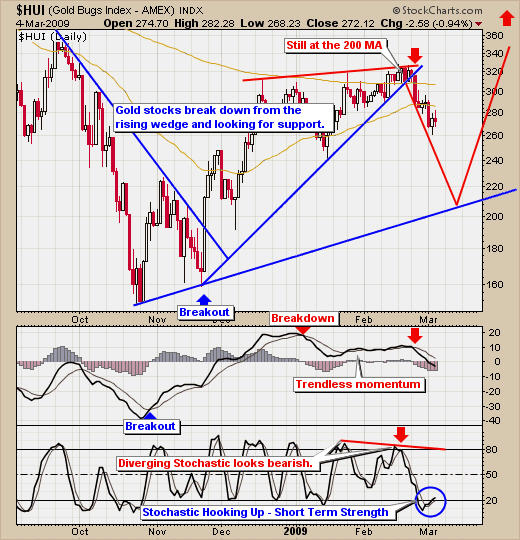
Gold Stocks – HUI Chart
Gold stocks continue to pull back but are showing signs of support as they performed better than gold today, which is a bullish sign for gold. Also the Stochastic indicator has hooked up, indicating a short term reversal could be in store. Gold stocks still have a long way to fall, if they are to reach the support level. I don't think they will pull back that far before reversing but only time will tell.
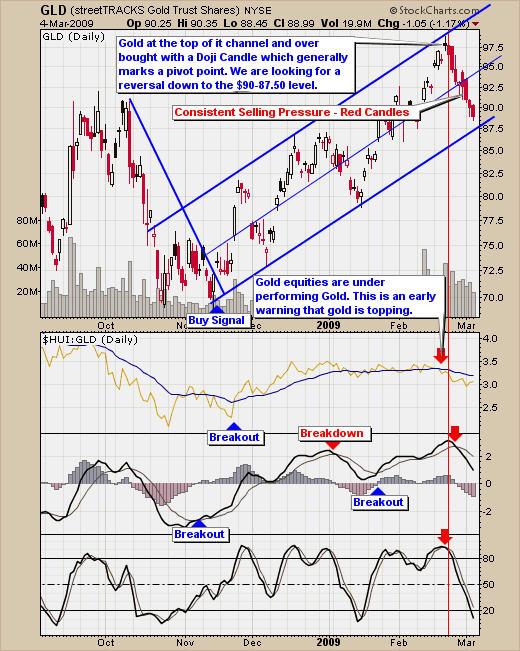
Gold Correction is Bleeding – Spot Gold/ GLD Fund
Gold looks to be having a controlled correction as it drifts back down to its support trend line. I mentioned a couple weeks ago that gold looked like it was topping and we will look to buy at support. Now gold is down near support and we are waiting for some type of bounce for us to enter long. Gold still looks to be in a strong down trend currently, so don't get too excited yet. The one thing that is concerning me is the fact that gold is bleeding down. What I mean is that each day it opens and slowly runs lower and lower and lower.
This is the same feeling that crude oil has been giving me for the past several months. This type of price action indicates to me that there is big money being pulled from gold while retail investors (small traders & investors) are buying. A few things hint to this and that is the open interest for gold, the recent performance of gold stocks and of course the price action of gold. Gold has been selling down with the broad market, which is a VERY weak sign for gold. This leads me to believe that gold could breakout down through this support trend line and slide to the $800-850 level. If this happens, we could see gold move sideways for 12+ months between the $700 - $1000 range similar to the price action in 2006 and 2007 before making another leg higher.
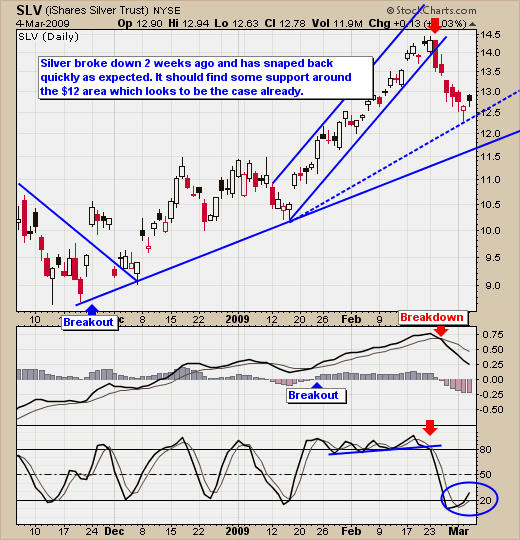
Silver Looks to be Shining
Silver looks like it may have found a bottom here and bounced higher today. Because it is not viewed as much of a safe haven, it does not have as many traders pulling money out, this moved higher with the broad market and other base metals today.
Precious Metals Trading Conclusion:
Gold stocks and silver look ready for a bounce, but gold continues to look weak. Because of gold's popularity, I expect that once it starts to rally, it will pop quickly to the $1000 area for another ram at moving above that major resistance level.
Light Crude Oil Makes a SWEET Signal
Light Sweet Crude Oil has been killing traders for months, as the price keeps bleeding lower week after week, sucking bottom pickers dry. After 8 months there seems to be light at the end of the tunnel for the oil bulls.
Crude Oil ETF's Hurt the Trading Account
Many traders have been hurt trading the crude oil etf funds; they are subject to contango, which I explained in a previous report a couple weeks ago. When trading oil and many other ETF's, which are to mirror an underlying commodity like oil, it is important to use the commodity prices for buy and sell signals not the oil funds. Many of the oil funds give a buy and sell signal (breakout) during most rallies or sell offs luring in novice traders to buy or short oil only to find out they bought at the ultimate worst time as the price rolls over on them. Here I show actual crude oil for these possible buy signals on the weekly and daily charts.
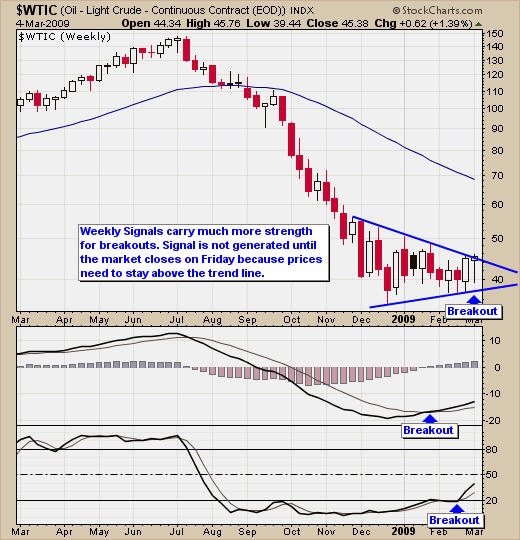
Light Sweet Crude Oil Trading Signals
The weekly chart clearly shows oil is trying to bottom and this could be confirmed as soon as Friday if the price stays above the resistance trend line. We will keep our eye on this because weekly buy signals are generally very powerful and are multi week moves.
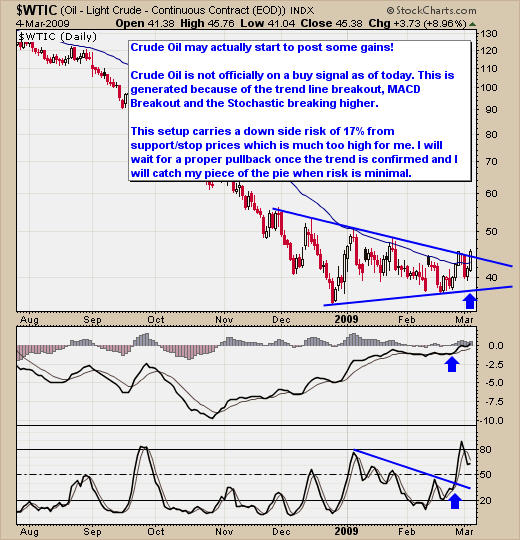
Daily Trading Chart – Light Sweet Crude Oil
The daily crude oil chart generated a buy signal today which is very exciting. Risk for this buy signal is over 17% which is too high for my blood. I will wait for a rally or pullback with a reversal before entering long. Keeping risk low is extremely important during volatile times, which we are in now.
Light Sweet Crude Oil Trading Conclusion:
Crude oil has been trying to move higher for several months and today it finally looks like it's making some progress. It has a ton of work to do to continue higher but with the amount of traders and investors watching the price of oil I expect we will see prices push much higher over the next 6 months, if these buy signals follow through and hold strong till Friday.
I just finished reading a book written by JT Grenough, about what you can do to protect yourself in this new world order economic environment. It's about crisis investing for 2009 covering gold, oil and real estate. Definitely worth reading!
Hello, I'm Chris Vermeulen founder of TheGoldAndOilGuy and NOW is YOUR Opportunity to start trading GOLD, SILVER & OIL for BIG PROFITS. Let me help you get started.
I have put together a Recession Special package for yearly subscribers which is if you join for a year ($299) I will send you $150 FREE in gas, merchandise or grocery vouchers FREE which work with all gas stations, all grocery stores and over 100 different retail outlets in USA & Canada.
If you interested please act fast as I only have 67 of these vouchers before they are gone for good.
If you would like to receive my free weekly market updates please visit my website: www.TheGoldAndOilGuy.com
I look forward to hearing from you soon!
By Chris Vermeulen
Chris@TheGoldAndOilGuy.com
Please visit my website for more information. http://www.TheGoldAndOilGuy.com
Chris Vermeulen is Founder of the popular trading site TheGoldAndOilGuy.com. There he shares his highly successful, low-risk trading method. For 6 years Chris has been a leader in teaching others to skillfully trade in gold, oil, and silver in both bull and bear markets. Subscribers to his service depend on Chris' uniquely consistent investment opportunities that carry exceptionally low risk and high return.
This article is intended solely for information purposes. The opinions are those of the author only. Please conduct further research and consult your financial advisor before making any investment/trading decision. No responsibility can be accepted for losses that may result as a consequence of trading on the basis of this analysis.
Chris Vermeulen Archive |
© 2005-2022 http://www.MarketOracle.co.uk - The Market Oracle is a FREE Daily Financial Markets Analysis & Forecasting online publication.