


Gold and Silver Bull Market Progress Report
Commodities / Gold and Silver 2012 Apr 17, 2012 - 01:06 PM GMTBy: Peter_Degraaf

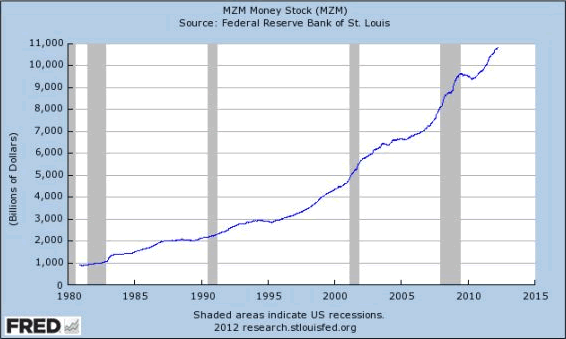
 As the following chart (courtesy Federal Reserve Bank of St. Louis) reveals, Central Bank easing continues 'to the sky.'
"Inflation is as violent as a mugger, as frightening as an armed robber and as deadly as a hit man. " President Ronald Reagan.
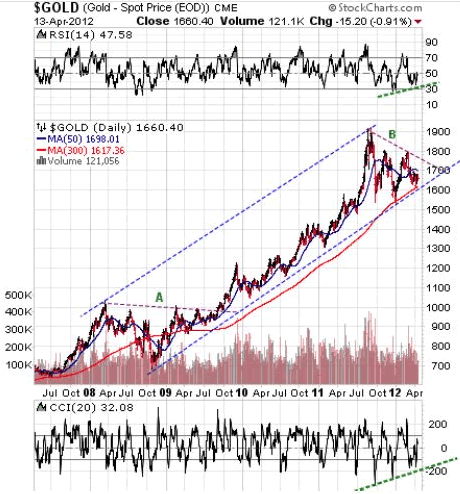
Featured is the 5 year gold chart courtesy Stockcharts.com. The blue channel has defined the uptrend since 2008. Except for the credit crunch in 2008, the 300DMA (used here) has not been violated. The chances of a 2008 type of correction are slim, due to the amount of liquidity that has been added to the system. A bounce off the $1600 level and a breakout at line 'B' will lead to the expectation that price is likely to repeat a performance last seen when line 'A' was overcome.
According to FinanceAsia.com/news in an article by Lillian Liu, the gold supply shortfall in China has widened ten times since 2007. China digs up thousands of tonnes of rock and ore each year, but it still cannot produce enough gold to keep up with the country's soaring demand. Despite being the world's biggest gold producer since 2007, China's supply shortfall has deepened by nearly 10 times during the past four years. Chinese investors remain attracted to all that glitters, even as the price of gold has soared. "The shortage in supply has been deepening very fast; from 48 tonnes in 2007 to 400 tonnes in 2011," said Song Xin, chief executive of China Gold International, the listing unit of China National Gold, one of the country's biggest gold producers. According to the China Gold Association, China's gold mines produced a combined 361 tonnes of the yellow metal last year, which was 5.8% more than the year before, but not nearly enough to meet the 33% growth in the country's consumption of bullion, which totalled 761 tonnes.
The increased demand is highest for bullion and coins. "Our customers are high-net-worth individuals as well as common householders," said Song. "They seem to have lost faith in the stock markets, so they turn to buy physical gold as an investment or as gifts for family members."
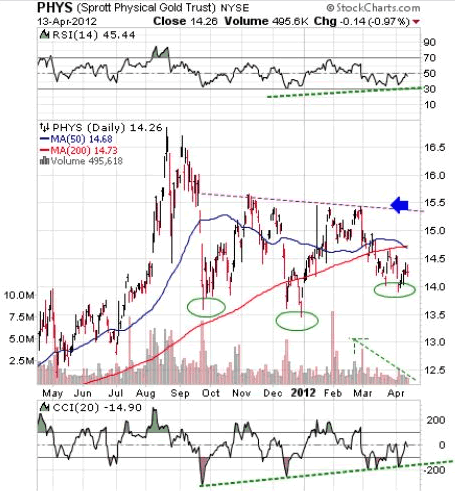
Featured is the daily bar chart for PHYS the Sprott gold trust. Price is working on the right shoulder in an inverted 'head and shoulders' formation. Volume has been dropping during the current pullback (green arrow), indicating that selling is drying up. The supporting indicators are positive (green lines). A breakout at the blue arrow will confirm the H&S pattern. The premium over bullion is a bullish 2.26%.
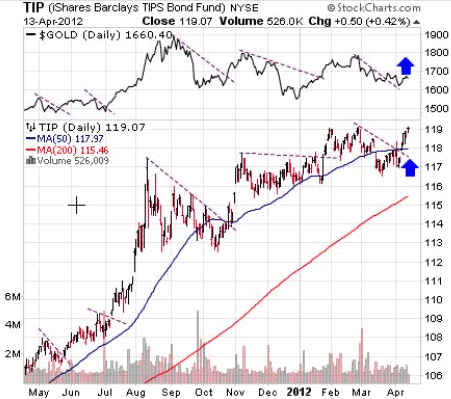
Featured is the daily bar chart for TIP, the bond fund that is indexed for inflation. The gold price is added at the top for comparison. Almost every time price breaks out; it coincides with or precedes a breakout in the price of gold. The expectation is that the latest breakout in TIP will soon be matched by gold.
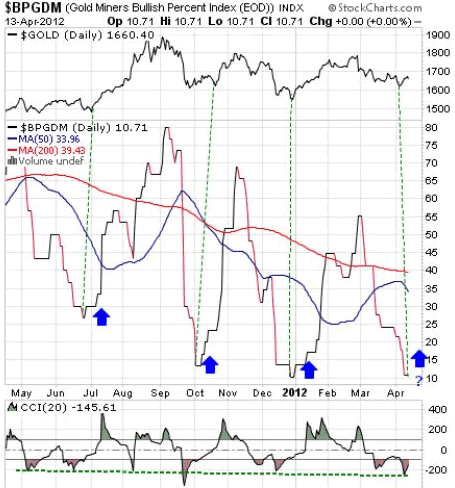
Featured is the Gold Miners Bullish Percent Index. The gold price is added at the top of the chart for comparison. Historically, whenever this Index bottoms below 30, it has resulted in a buying opportunity for gold bulls.
A few words about silver. The next chart, courtesy 24hgold.com shows a rapid drawdown of silver eligible for delivery at the COMEX warehouses.
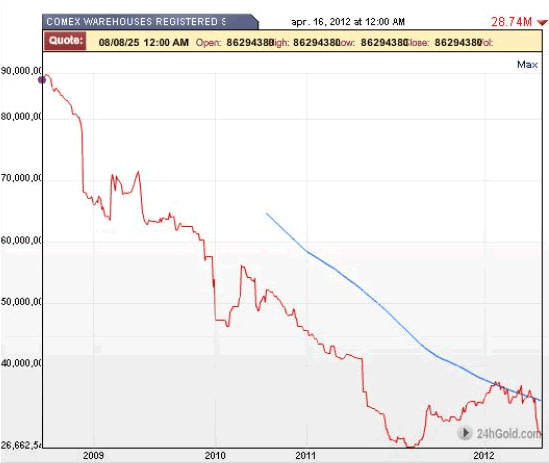
On Dec 1.2011 the number of eligible ounces totaled 35.01 million. As of today that number is down to 28.74 million, a drop of almost 20%. When the eligible ounces at the COMEX drop to zero, (actually some time before that), the COMEX will be out of the silver trading business. This will allow silver to seek its true supply/demand value without 'paper silver' or 'digital silver' interfering with the price.
"The great Khan (Chinese ruler), causes the bark of trees, made into something like paper, to pass for money all over his country." Marco Polo, (1254 - 1324 Traveling explorer from Venice).
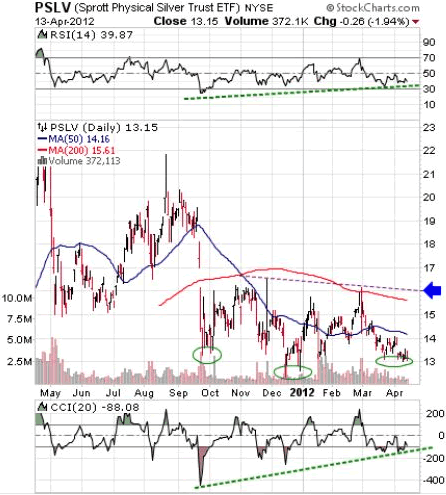
Featured is PSLV the Sprott Silver Trust. Price is carving out a bullish inverted 'head and shoulders' formation. The supporting indicators are positive. A breakout at the blue arrow will confirm the pattern. The premium over bullion is bullish at 4.87%.
Summary: Historically, since the beginning of the current bull market in gold and silver, prices generally rise during April and May. The Gold and Silver Producers ETF (GDX) has reached the Fibonacci 38.2% support level and it is overdue for a rise. Some of you will say: 'What about the bullion banks that are short millions of ounces of gold and silver, what is to stop them from keeping prices from rising by selling even more contracts?' They are slowly but surely being stopped by people and companies buying physical metal. The demand for physical gold and silver puts a floor under the metals that manipulators cannot penetrate. This floor has been rising at about 20% per year on average. The central banks do not like this rise but they can live with it. They cannot live with prices doubling in a year, for that would expose the fact that their currencies are crumbling.
Happy trading!
By Peter Degraaf
Peter Degraaf is an on-line stock trader with over 50 years of investing experience. He issues a weekend report on the markets for his many subscribers. For a sample issue send him an E-mail at itiswell@cogeco.net , or visit his website at www.pdegraaf.com where you will find many long-term charts, as well as an interesting collection of Worthwhile Quotes that make for fascinating reading.
© 2012 Copyright Peter Degraaf - All Rights Reserved
DISCLAIMER: Please do your own due diligence. I am NOT responsible for your trading decisions.
Peter Degraaf Archive |
© 2005-2022 http://www.MarketOracle.co.uk - The Market Oracle is a FREE Daily Financial Markets Analysis & Forecasting online publication.