


What Will the Stock Market Do Around Earnings Season
Stock-Markets / Stock Markets 2019 Jan 15, 2019 - 03:21 PM GMTBy: Troy_Bombardia

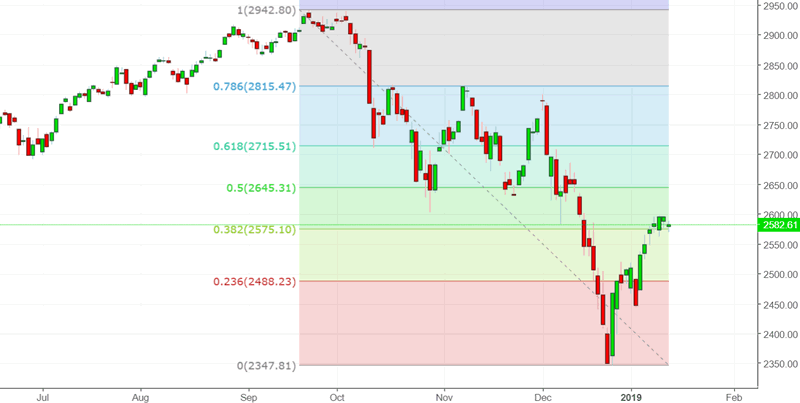
The U.S. stock market has done well throughout the first half of January 2019. With earnings season just ahead and the stock market under its 200 day moving average, the high probability of a pullback/retest remains.
Go here to understand our fundamentals-driven long term outlook.
Let’s determine the stock market’s most probable medium term direction by objectively quantifying technical analysis. For reference, here’s the random probability of the U.S. stock market going up on any given day.

*Probability ≠ certainty. Past performance ≠ future performance. But if you don’t use the past as a guide, you are blindly “guessing” the future.
January earnings season
Earnings season has started, and the S&P 500 is under its 200 day moving average.
- When the stock market crashes just before earnings season, it almost always rallies during earnings season, even if the earnings reports are bad. This was true even in the darkest hours of 2008. (Earnings report = trigger).
- When the stock market doesn’t crash just before earnings season (i.e. right now), the stock market can go up, down, or sideways on their earnings report (i.e. random outcome).
Here’s what happened next to the S&P 500 during the last 3 weeks of January (earnings season), while it is below its 200 dma.
*Data from 1950 – present
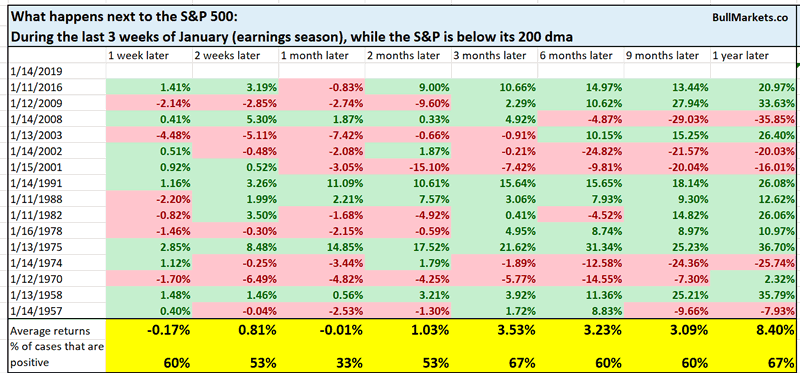
As you can see, the stock market has a bearish tendency over the next 1 month. Perhaps stocks will fall after earnings season is over? We don’t focus on the short term.
Macro Context
V-shaped recovery
The stock market’s recent rally has been rather incessant, with all the intraday dips being bought.
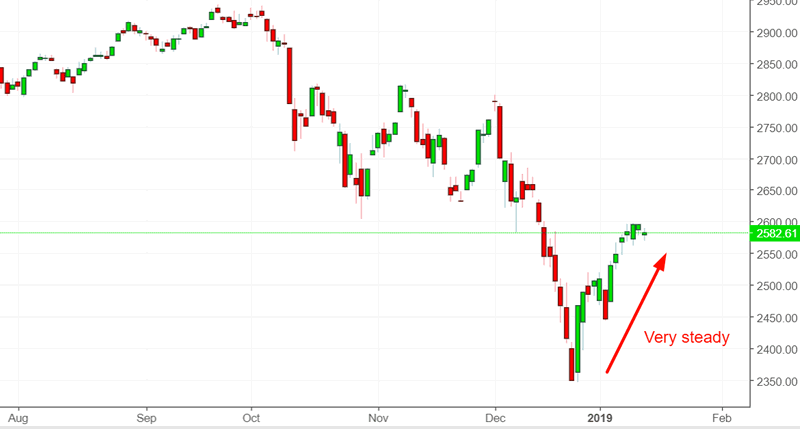
11 of the past 13 days have seen the S&P close higher than the daily OPEN.
Here are similar cases, from 1962 – present
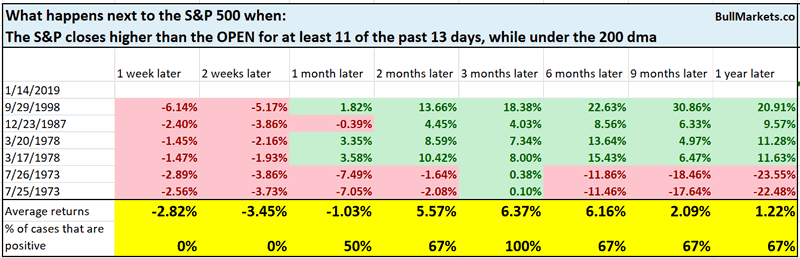
This is rare. As you can see, the stock market tends to fall over the next 2 weeks, but forward returns 3 months later are bullish.
VIX change
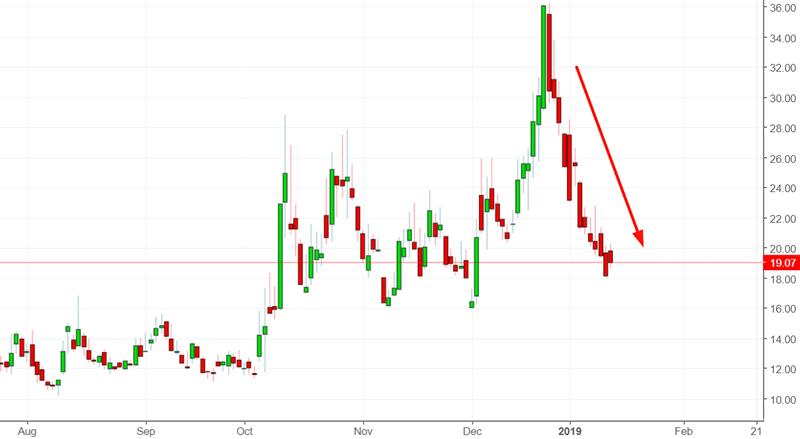
After spiking in December, VIX is trending downwards as the stock market trends upwards.
Here’s what happens next to the S&P when VIX’s 10 week rate goes from greater than 85% to less than -20% in 5 weeks.
*Data from 1990 – present
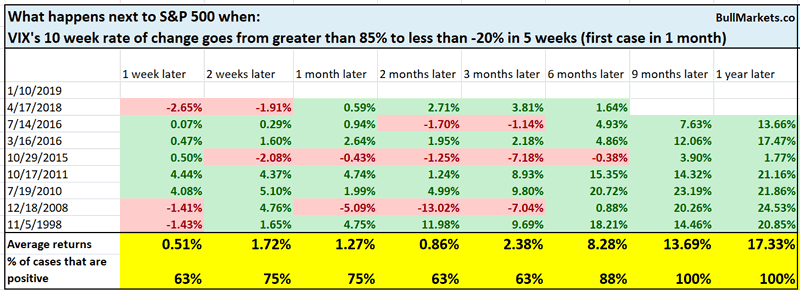
As you can see, this is quite bullish for the stock market 6-12 months later
What this means for VIX
S&P 500’s 10 week rate of change
The S&P has mirrored VIX. It’s 10 week rate of change has gone from under -15% to above -3.5% in 3 weeks.
Here are all the historical cases, from 1923 – present
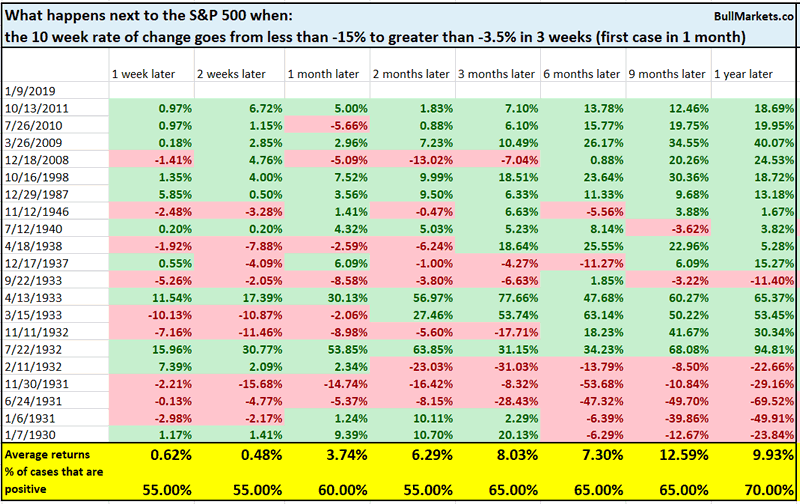
You can see that most of the long term bearish cases happened before WWII. Let’s look at all the cases after 1950.
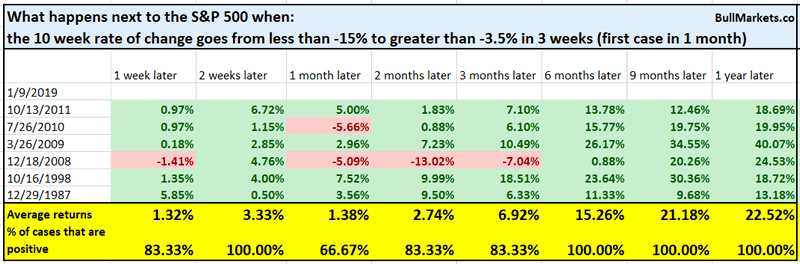
Once again, you can see how this is bullish for stocks 6-12 months later.
Average implied move
According to CNBC, the average implied move on S&P 500 stocks for their earnings reports is at its highest since 2009.
This has an inverse correlation with the S&P. (When the stock is already very volatile without earnings, of course the market will expect the stock to be very volatile with earnings.)
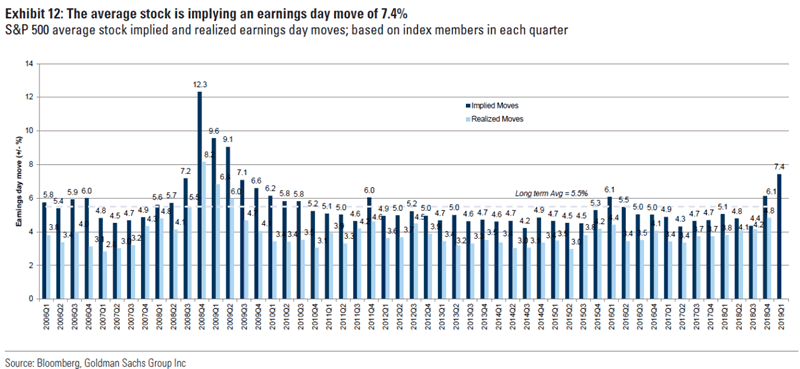
You can see this as a long term bullish sign, but I wouldn’t. n=1
10 year Treasury yield
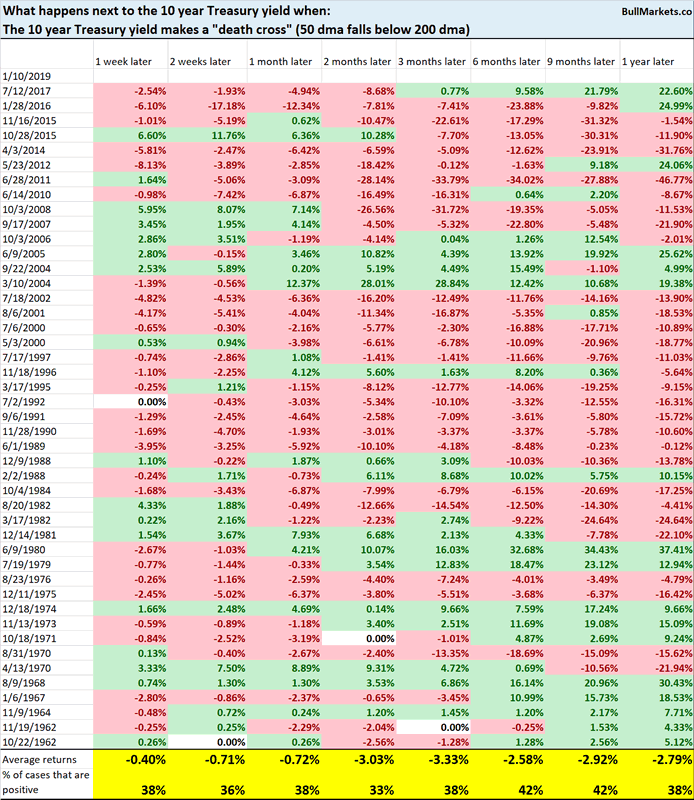
The 10 year Treasury yield’s “death cross” has gotten a bit of attention in the media recently (death cross = 50 dma falling below the 200 dma).
Here’s what happened next to the S&P when the 10 year yield made a death cross.
*Data from 1962 – present
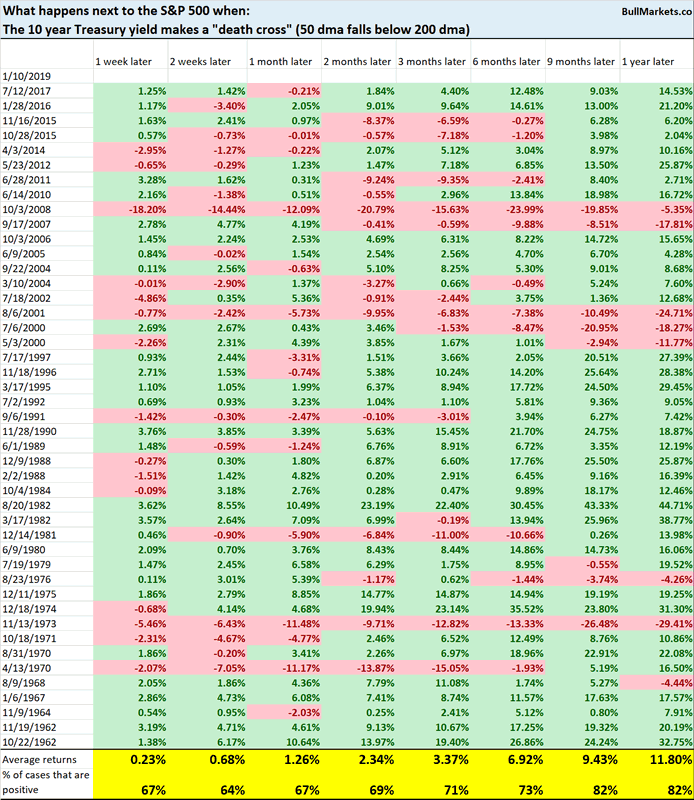
As you can see, the stock market’s forward returns are mostly random, with a slight bullish edge 9-12 months later.
However, this is a bearish sign for Treasury yields (bullish for bonds).
Macro Context & 10 year Treasury yield
Click here for yesterday’s market study
Conclusion
Here is our discretionary market outlook:
- The U.S. stock market’s long term risk:reward is no longer bullish. This doesn’t necessarily mean that the bull market is over. We’re merely talking about long term risk:reward. Long term risk:reward is more important than trying to predict exact tops and bottoms.
- The medium term direction is still bullish (i.e. trend for the next 6 months). However, if this is the start of a bear market, bear market rallies typically last 3 months. They are shorter in duration.
- The stock market’s short term has a slight bearish lean. Focus on the medium-long term because the short term is extremely hard to predict.
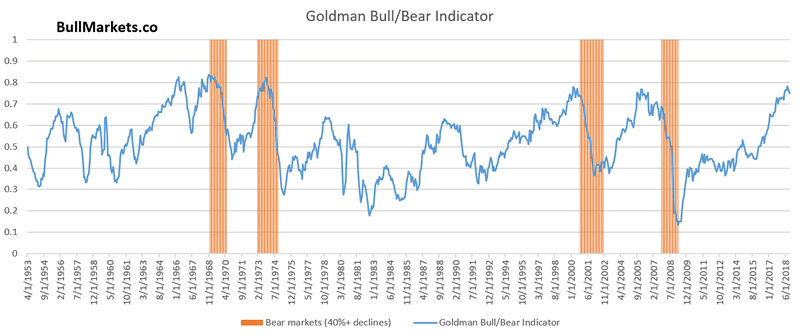
Goldman Sachs’ Bull/Bear Indicator demonstrates that while the bull market’s top isn’t necessarily in, risk:reward does favor long term bears.
Our discretionary market outlook is not a reflection of how we’re trading the markets right now. We trade based on our clear, quantitative trading models, such as the Medium-Long Term Model.
Members can see exactly how we’re trading the U.S. stock market right now based on our trading models.
Click here for more market studies
By Troy Bombardia
I’m Troy Bombardia, the author behind BullMarkets.co. I used to run a hedge fund, but closed it due to a major health scare. I am now enjoying life and simply investing/trading my own account. I focus on long term performance and ignore short term performance.
Copyright 2019 © Troy Bombardia - All Rights Reserved
Disclaimer: The above is a matter of opinion provided for general information purposes only and is not intended as investment advice. Information and analysis above are derived from sources and utilising methods believed to be reliable, but we cannot accept responsibility for any losses you may incur as a result of this analysis. Individuals should consult with their personal financial advisors.
© 2005-2022 http://www.MarketOracle.co.uk - The Market Oracle is a FREE Daily Financial Markets Analysis & Forecasting online publication.