


Stock Market Investor Sentiment Finally Turns Neutral
Stock-Markets / Stock Market Sentiment Feb 14, 2010 - 06:14 AM GMTBy: Guy_Lerner

 Finally, the "Dumb Money" indicator has turned neutral after spending 28 consecutive weeks in the extreme bullish zone. For those keeping score at home, the S&P500 gained 8.9% over the past 28 weeks. For the sake of comparison, investor sentiment was either bearish or neutral for the 9 weeks following the March 6, 2009 bottom, and over that time, the S&P500 gained 36%. I will leave it to you as to which market environment I want to put my money to work.
The "Dumb Money" indicator, which is shown in figure 1, looks for extremes in the data from 4 different groups of investors who historically have been wrong on the market: 1) Investor Intelligence; 2) Market Vane; 3) American Association of Individual Investors; and 4) the put call ratio. The "Dumb Money" indicator has finally turned neutral.
Figure 1. "Dumb Money" Indicator/ weekly
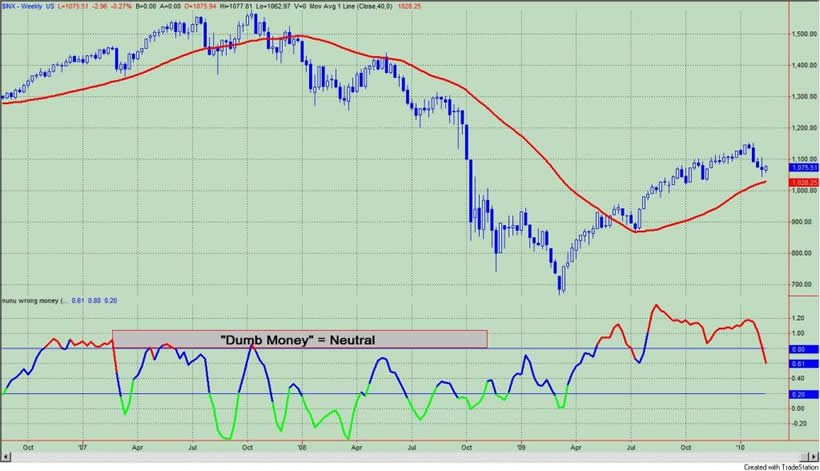
The last time the indicator flipped from a bullish extreme to a neutral reading was back on July 10, 2009. Over the next 4 weeks, the S&P500 went for a 15% gain. At the time, it was my feeling that this moonshot was nothing more than short covering. Will this happen again? Anything is possible but from a sentiment perspective there are differences worth noting between the current market environment and the one seen over the summer. Back in July, the "smart money" was bullish to neutral; currently the "smart money" is neutral to bearish. Company insiders have been net sellers in both time periods. The Rydex market timers were very bearish back in July such that buy signals were turning up on both the weekly and daily charts. Currently, these market timers are betting bearishly, which is bullish, but it is not to the extreme levels seen in July.
Despite the recent short term strength and bearishness of investors, it is still my contention that we will need to go lower before heading meaningfully higher. I discussed the research behind this claim in the article, "Why I Think We Need To Go Lower Before Going Higher".
The "Smart Money" indicator is shown in figure 2. The "smart money" indicator is a composite of the following data: 1) public to specialist short ratio; 2) specialist short to total short ratio; 3) SP100 option traders. The Smart Money indicator is neutral to bearish. I have circled the July, 2009 time period in the figure.
Figure 2. "Smart Money" Indicator/ weekly
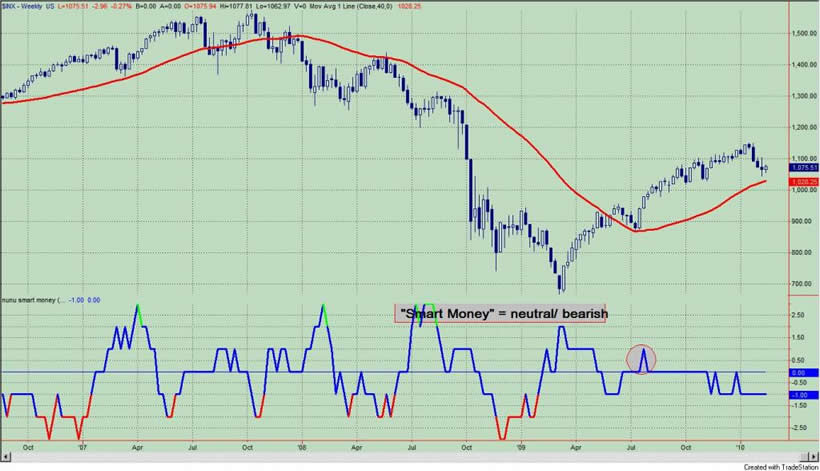
Figure 3 is a weekly chart of the S&P500 with the InsiderScore "entire market" value in the lower panel. Insider trading volumes remain light with little conviction in either direction.
Figure 3. InsiderScore Entire Market/ weekly
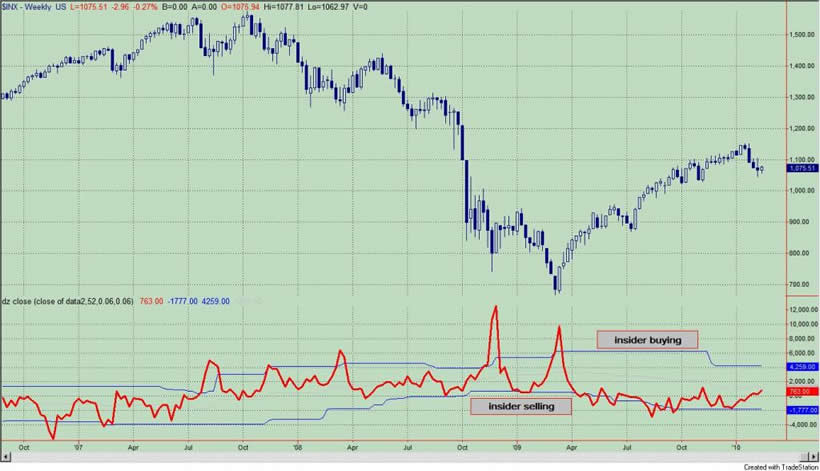
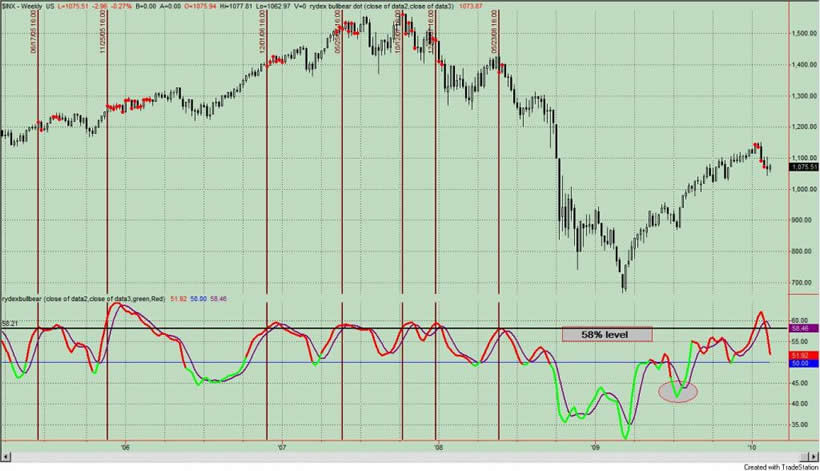
Figure 4 is a weekly chart of the S&P500. The indicator in the lower panel measures all the assets in the Rydex bullish oriented equity funds divided by the sum of assets in the bullish oriented equity funds plus the assets in the bearish oriented equity funds. When the indicator is green, the value is low and there is fear in the market; this is where market bottoms are forged. When the indicator is red, there is complacency in the market. There are too many bulls and this is when market advances stall.
Currently, the indicator is red having peaked (with the market) above 58%. In other words at the market peak 5 weeks ago, greater than 58% of the assets were in bullish funds (leveraged and non leveraged) relative to all of the equity funds. There is nothing magical about the number 58%, but intermediate term swings in the past 10 years have been identified when this indicator exceeded the 58% mark. These extremes in the indicator are noted by the red dots on the price chart and the maroon colored vertical lines.
The gray oval on the indicator shows how extreme (relative to now) the Rydex market timers were at the July lows.
Figure 4. Rydex Total Bull v. Total Bear/ daily
By Guy Lerner
http://thetechnicaltakedotcom.blogspot.com/
Guy M. Lerner, MD is the founder of ARL Advisers, LLC and managing partner of ARL Investment Partners, L.P. Dr. Lerner utilizes a research driven approach to determine those factors which lead to sustainable moves in the markets. He has developed many proprietary tools and trading models in his quest to outperform. Over the past four years, Lerner has shared his innovative approach with the readers of RealMoney.com and TheStreet.com as a featured columnist. He has been a regular guest on the Money Man Radio Show, DEX-TV, routinely published in the some of the most widely-read financial publications and has been a marquee speaker at financial seminars around the world.
© 2010 Copyright Guy Lerner - All Rights Reserved
Disclaimer: The above is a matter of opinion provided for general information purposes only and is not intended as investment advice. Information and analysis above are derived from sources and utilising methods believed to be reliable, but we cannot accept responsibility for any losses you may incur as a result of this analysis. Individuals should consult with their personal financial advisors.
Guy Lerner Archive |
© 2005-2022 http://www.MarketOracle.co.uk - The Market Oracle is a FREE Daily Financial Markets Analysis & Forecasting online publication.