


Current Stock Market S&P Index P/E Ratio in Historical Perspective
Stock-Markets / Stock Market Valuations Nov 05, 2008 - 06:24 AM GMTBy: Richard_Shaw

 As we look for a bottom and read articles about P/E ratios as they relate to historical norms, it can be quite confusing.
The numbers seem all over the lot. The principle reason is that there are many different methods of calculating P/E, and the norms against which they are compared are not always calculated on the same basis (particularly if comparing operating earnings P/E versus “as reported” historical figures).
This articles tries to put the current and normative values on the same basis.
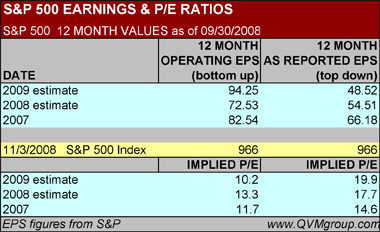
The table above contains the 2007 actual and 2008-2009 earnings estimates for the S&P 500 from Standard & Poor's.
Earnings are stated in two ways; “operating earnings” (often referred to in the press as “earnings ex items”) and “as reported” earnings (translate as “earnings with items”). Since there are always “items” in any reporting quarter for an index, we think greater emphasis on “as reported” is appropriate.
The table also shows the closing value of the S&P 500 index (proxies SPY and IVV) today, and calculates the implied P/E for each year for each of the two methods of stating earnings.
It is clear from the table that people could have substantial misunderstandings when they hear quite correctly from one source that estimated 2009 P/E is 10.2, and then somewhere else in the same day hear that the estimated 2009 P/E is 19.9. They are both true in their own way.
If different reports use different time periods (such as trailing 12 months, or current year or next year), the confusion can grow deeper. And, if the source of the estimates is different, with different estimated amounts for the same time periods with the same nominal methods — well, it just gets plain bewildering.
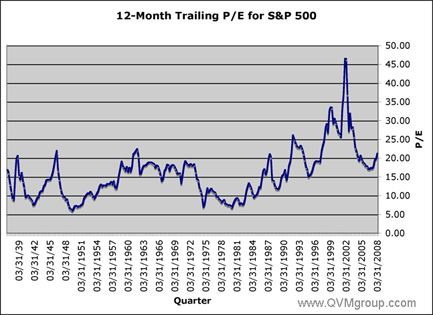
If we stick with 17.7 for the most recent Standard & Poor's 2008 estimated 12-month trailing P/E using “as reported” earnings, let's see where that stacks up historically by comparing it to 12-month trailing historical “as reported” P/E's from 1936.
Historical 12-Month Trailing “As Reported” Earnings:
The chart data goes from 1936 through Q1 2008.
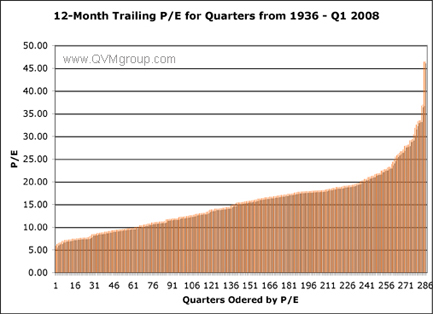
Reordering the 289 quarters from lowest P/E to highest P/E, the chart looks like this. The highest P/E being that of the dot.com bubble.
Means, Minimums and Maximums:
All Periods : Since 1936, the S&P mean trailing “as reported” P/E is 15.8. The minimum is 5.9 (in Q2 1949). The maximum is 46.5 (in Q4 2001).
Middle 80% Periods : If we eliminate the 10% extremes from each end of the chart (using the middle 80%), the mean is 15.0, the minimum 8.5, and the maximum 23.2.
Middle 60% Periods : If we eliminate the 20% extremes from each end of the spectrum (using the middle 60%), the mean is 15.0, the minimum 9.9, and the maximum 19.2.
Conservative Rule of Thumb : From middle 60%, we would generalize a rule of thumb that markets between 10x and 20x “as reported” trailing earnings are “normal” and that 15x is a neutral valuation.
Current Market Value Interpretation:
A 17.7 “as reported” 2008 estimate trailing 12-month P/E is an above mean valuation based on the 72 year history from 1936.
There are more factors than P/E in a fair value determination, and it may make a difference whether earnings are at a peak or trough when taking the measure, but in this single dimension without parsing other conditions, the valuation is above the long-term normal
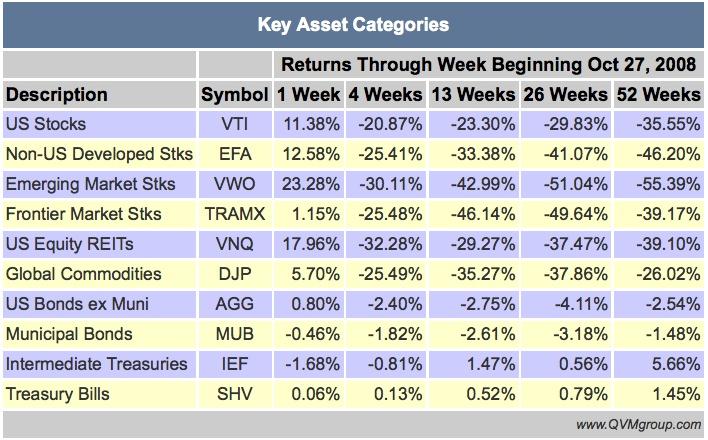
Short-Term Returns for Key Assets of Last Friday:
Weekly updated return charts for these and many other assets are available on our site:
By Richard Shaw
http://www.qvmgroup.com
Richard Shaw leads the QVM team as President of QVM Group. Richard has extensive investment industry experience including serving on the board of directors of two large investment management companies, including Aberdeen Asset Management (listed London Stock Exchange) and as a charter investor and director of Lending Tree ( download short professional profile ). He provides portfolio design and management services to individual and corporate clients. He also edits the QVM investment blog. His writings are generally republished by SeekingAlpha and Reuters and are linked to sites such as Kiplinger and Yahoo Finance and other sites. He is a 1970 graduate of Dartmouth College.
Copyright 2006-2008 by QVM Group LLC All rights reserved.
Disclaimer: The above is a matter of opinion and is not intended as investment advice. Information and analysis above are derived from sources and utilizing methods believed reliable, but we cannot accept responsibility for any trading losses you may incur as a result of this analysis. Do your own due diligence.
Richard Shaw Archive |
© 2005-2022 http://www.MarketOracle.co.uk - The Market Oracle is a FREE Daily Financial Markets Analysis & Forecasting online publication.