


Investing 2009- Leading ETFs, What To Watch Now
Stock-Markets / Exchange Traded Funds Apr 15, 2009 - 02:50 PM GMTBy: Chris_Ciovacco

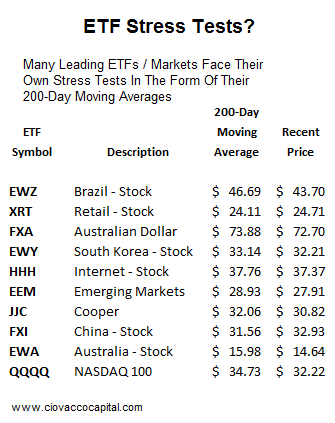
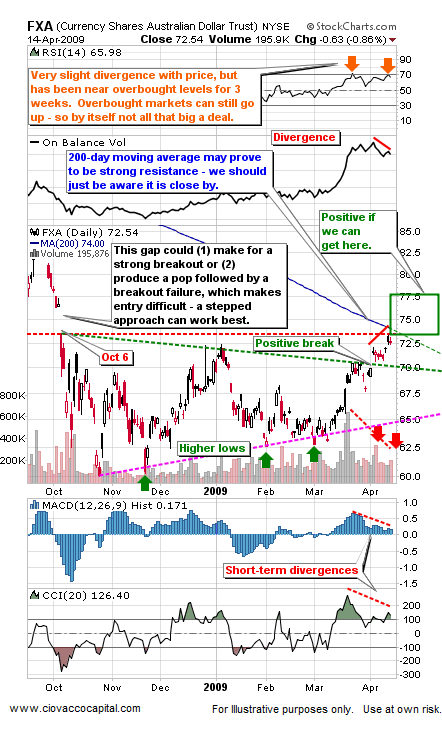
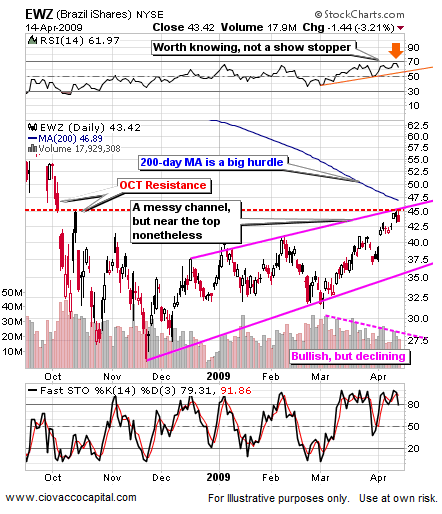
 For those less familiar with technical analysis, markets often pause or reverse at their 200-day moving average, which can act as strong resistance.
Fundamentals – Stress Tests May Understate Where Unemployment Is Headed: Before we get into the technicals, on the fundamental side, the bank stress tests are obviously big for the markets. Since the government feels this is a “crisis of confidence”, you can bet the announcements will err on the side of building confidence. If they tell us everything is “ok”, does that really mean everything is “ok”? The baseline stress scenario and the more extreme scenario are not all that stressful – they most likely underestimate where employment and defaults are headed. The baseline scenario is quite optimistic with unemployment forecasted to peak at 8.7% - we are at 8.5% now (www.bls.gov). The more adverse and “stressful” scenario has unemployment peaking at 10.4% in Q4 of 2010, which is more realistic, but may not capture where unemployment peaks as we continue to move away from a leveraged world – with capacity to produce goods for a highly leveraged world. From a recent NYT article:
Regulators say all 19 banks undergoing the exams will pass them. Indeed, they say this is a test that a bank simply will not fail: if the examiners determine that a bank needs “exceptional assistance,” the government, that is, taxpayers, will provide it.
At this point, the big stress test at 19 of the nation’s largest banks seems like something of a joke. . . .
From the always bubbly and sentimental Nouriel Roubini:
But if you look at the actual data today macro data for Q1 on the three variables used in the stress tests – growth rate, unemployment rate, and home price depreciation – are already worse than those in FDIC baseline scenario for 2009 AND even worse than those for the more adverse stressed scenario for 2009. Thus, the stress test results are meaningless as actual data are already running worse than the worst case scenario.
Some other comments on the stress tests can be found in the NYT blog (4/9/2009).
Technicals - Weekly Charts: Charts help us better understand who’s winning the battle between the bulls and bears, which is another way of saying it helps us monitor the basic relationship between supply and demand. Supply and demand (or conviction) determine price. In the final analysis, after all the noise, we care about price. Weekly charts (and monthly) help us take a step back from shorter-term volatility and better understand the strength of markets. For example, if a market pulls back, the daily chart will show weakness in numerous indicators (as we would expect). During the pullback, if the weekly chart remains healthy, then the correction may be just that - a correction (or healthy countertrend move). If the weekly chart also deteriorates on a pullback, then it may signal more than just a normal and healthy correction. Therefore, as markets rise or fall, the weekly and monthly charts can help us better understand the odds of higher highs (in an uptrend) or lower lows (in a downtrend). We always refer to odds and probabilities – not certainties or forecasts.
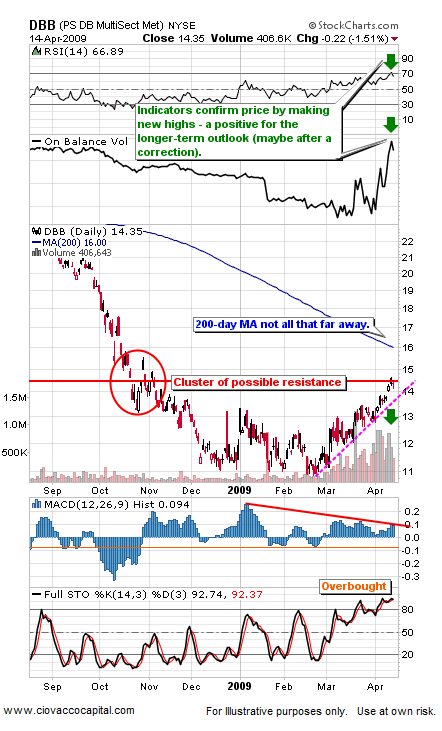
In technical analysis, indicators should confirm moves in prices. For example when prices make a new high, we would like to see numerous technical indicators make a new high as well. We see some positive confirmations of price via some of the indicators in the weekly chart of the base metals ETF (DBB).
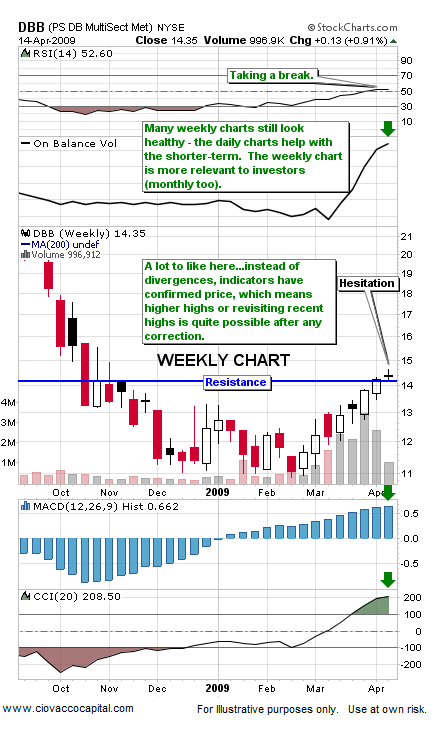
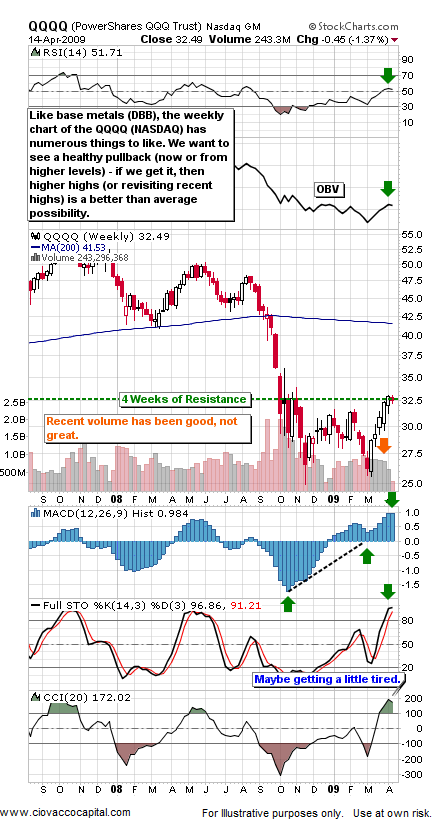
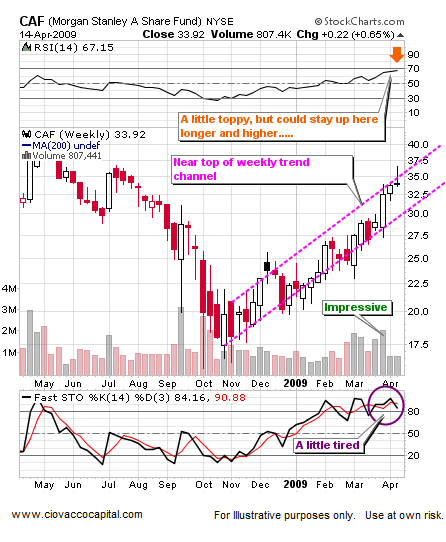
All charts as of April 14, 2009 close. Green arrows in the charts point out positive signals – orange arrows point to areas of some concern, and red arrows highlight areas of possible weakness, which could indicate a weakening trend.
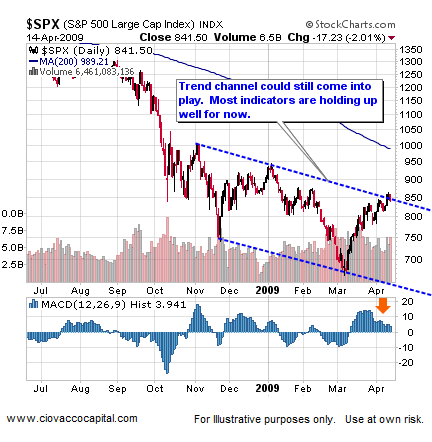
Daily Charts - Shorter-Term Health: Will the stress test results give the market the needed push to break through resistance or will they be a disappointment which keeps resistance and trend channels intact? We will have to monitor the situation with an open mind.
Retail stocks have been a leader in the current rally. How they perform going forward could be a proxy for all risk assets. From a fundamental perspective, you have to pause when considering bets on an over-leveraged consumer, who may be uncertain about their job security.
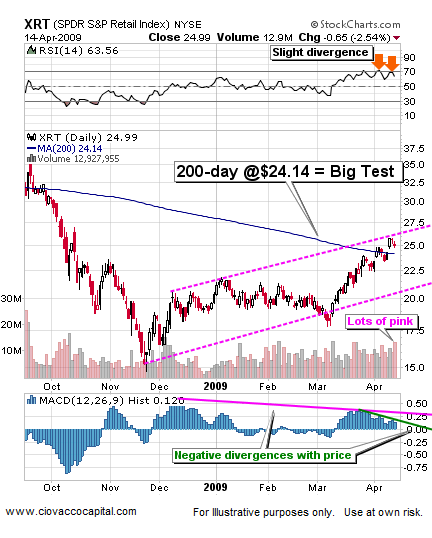
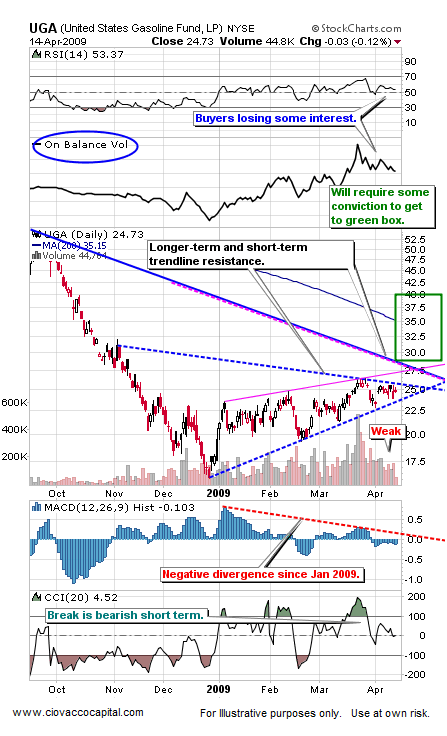
When prices make a new high, but an indicator fails to make a new high, we have what is known as a negative divergence. A negative divergence can be an early signal that the bulls are losing some of their grip on the bears. A single negative divergence in a single technical indicator is not all that disconcerting. However, the negative divergences become more significant when we see them in numerous indicators, across several markets, and in multiple time frames (daily, weekly, monthly). Below we present some negative divergences that may point to further corrections in risk assets. Since many of these divergences are shown on daily charts, they tell us to be cautious in the short-term. They do not necessarily send signals that these markets cannot advance after a correction has run its course.
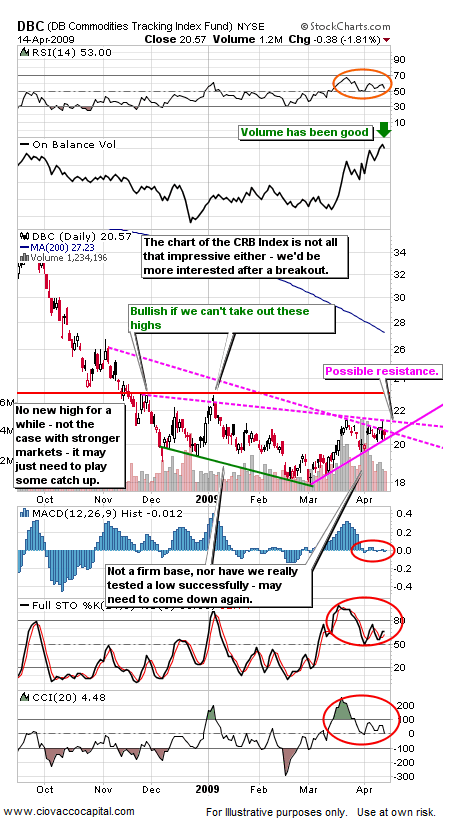
The lack of clarity in the charts of DBC and the CRB Index (commodities) does not give a strong vote of confidence to the theory of a V-shaped recovery. It is possible they are just lagging behind, but their indifference should be taken into account.
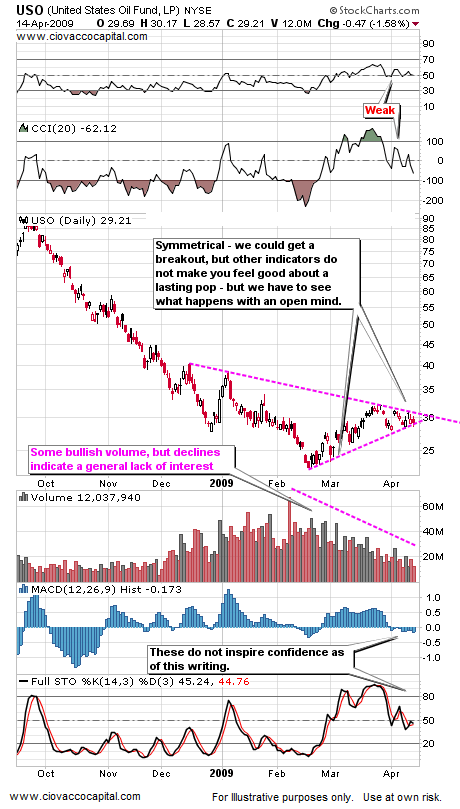
Some of the markets above represent the leaders of the current rally. Their path at points of potential resistance can be used to monitor the sustainability of the recent rally in all risk assets. If these markets can breakout in a convincing manner, we would be much more open to putting cash to work. Conversely, if we get unhealthy pullbacks at or near current levels, it may signal the move off the March 2009 lows was just another in a series of powerful bear market rallies. If we pay attention, these markets will give us some good information in the coming days, weeks, and months.
The charts and commentary above are for illustrative and educational purposes only and are not recommendations to buy or sell any security.
By Chris Ciovacco
Ciovacco Capital Management
Copyright (C) 2009 Ciovacco Capital Management, LLC All Rights Reserved.
Chris Ciovacco is the Chief Investment Officer for Ciovacco Capital Management, LLC. More on the web at www.ciovaccocapital.com
Ciovacco Capital Management, LLC is an independent money management firm based in Atlanta, Georgia. As a registered investment advisor, CCM helps individual investors, large & small; achieve improved investment results via independent research and globally diversified investment portfolios. Since we are a fee-based firm, our only objective is to help you protect and grow your assets. Our long-term, theme-oriented, buy-and-hold approach allows for portfolio rebalancing from time to time to adjust to new opportunities or changing market conditions. When looking at money managers in Atlanta, take a hard look at CCM.
All material presented herein is believed to be reliable but we cannot attest to its accuracy. Investment recommendations may change and readers are urged to check with their investment counselors and tax advisors before making any investment decisions. Opinions expressed in these reports may change without prior notice. This memorandum is based on information available to the public. No representation is made that it is accurate or complete. This memorandum is not an offer to buy or sell or a solicitation of an offer to buy or sell the securities mentioned. The investments discussed or recommended in this report may be unsuitable for investors depending on their specific investment objectives and financial position. Past performance is not necessarily a guide to future performance. The price or value of the investments to which this report relates, either directly or indirectly, may fall or rise against the interest of investors. All prices and yields contained in this report are subject to change without notice. This information is based on hypothetical assumptions and is intended for illustrative purposes only. THERE ARE NO WARRANTIES, EXPRESSED OR IMPLIED, AS TO ACCURACY, COMPLETENESS, OR RESULTS OBTAINED FROM ANY INFORMATION CONTAINED IN THIS ARTICLE. PAST PERFORMANCE DOES NOT GUARANTEE FUTURE RESULTS.
Chris Ciovacco Archive |
© 2005-2022 http://www.MarketOracle.co.uk - The Market Oracle is a FREE Daily Financial Markets Analysis & Forecasting online publication.