


Gold and Silver Developing Bearish Formations
Commodities / Gold & Silver 2009 Apr 18, 2009 - 07:58 PM GMTBy: Merv_Burak

 Since reaching its recent high in late February gold has been tracking a basic downward path. It closed on Friday at a new reaction low. Is this to continue into a new bear market move or are we in for a reversal ahead?
GOLD LONG TERM
We’ve had an up move and a down move on that long term point and figure (P&F) chart shown last week but other than that there is no change to its message. It is still in a BEAR mode with a projection to the $705 level.
As for the normal indicators, those also haven’t changed although they are getting very, very close to a reversal signal from their present bullish rating. The price of gold is sitting right on top of its still positive sloping moving average line and the momentum indicator remains in its positive zone. The momentum indicator is, however, only very slightly above its neutral line and heading lower below its negative sloping trigger line. Another down week in the price of gold and most likely we will see these indicators go negative. The volume indicator continues to move in a basic horizontal direction with a slight negative bias. It is below its negative sloping trigger line. However, looking at all the indicators the long term rating continues to be BULLISH but in a very, very precarious position.
INTERMEDIATE TERM
Everything on the intermediate term just keeps getting more negative. The price of gold is moving further away from its intermediate term negative sloping moving average line and the momentum indicator has once more moved into its negative zone below its negative sloping trigger line. The volume indicator continues to drift slightly lower below its negative sloping trigger line. Finally, the short term moving average line is moving further and further away and below the intermediate term line. We have consistently seen that a trend reversal has a rough time as long as the short term moving average line continues below its intermediate term line. On the intermediate term the only rating I can give is a BEARISH rating.
SHORT TERM
When we have the very short term moving average line (8 DMAw) below the short term line, and heading lower, it’s a good guess that the short term direction is not to the up side. Gold tried to break above its short term moving average line during the week but failed. It is once more moving lower, below its negative sloping short term line. The short term momentum indicator remains in its negative zone where it has basically been for about the past two months (except for a very brief period in mid-March). The daily volume activity has been very low recently but I expect that will perk up shortly. On the short term the rating continues to be BEARISH.
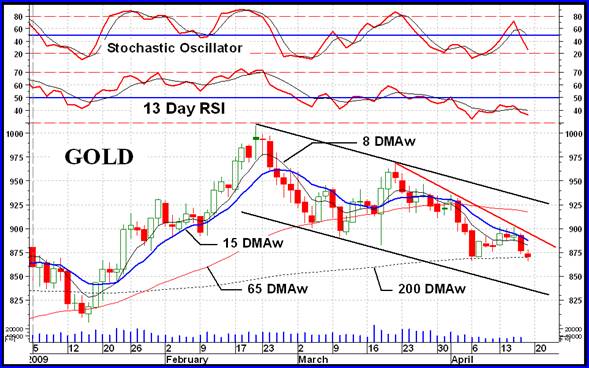
As for the immediate direction of least resistance, well, after a brief rally in the Stochastic Oscillator it has once more moved into its negative zone and heading lower. The short term trend continues lower as the red trend line shows. The direction is therefore towards the down side for now.
SILVER
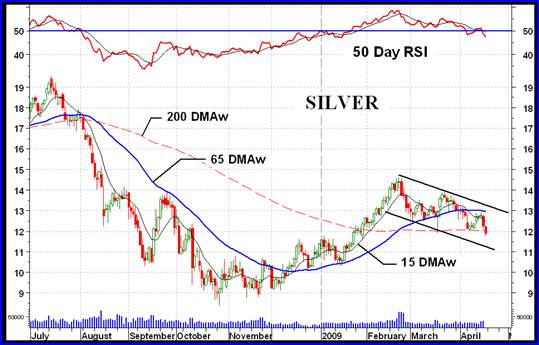
Recently silver seems to be under performing gold. It has broken into new reaction lows since hitting its high in February but has not yet issued a P&F bear signal, unlike gold. What we see on the chart is what is often referred to as a downward sloping bullish flag pattern. It often occurs at a move’s half way point and is a time when the price takes a breather, resting up for its next thrust. If that’s the case and the price does reverse back to the up side then that implies a move to about the $18 mark. That’s not far from my point and figure projection of $18.50.
For now the intermediate term, which is the time period I find most important, has indicated a bearish trend. The price is below its intermediate term moving average line and the line slope has turned downward. The momentum indicator has moved into its negative zone and is below its negative trigger line. And, of course, the short term moving average line remains below the intermediate term line. The intermediate term rating can only be BEARISH until things perk up.
PRECIOUS METAL STOCKS
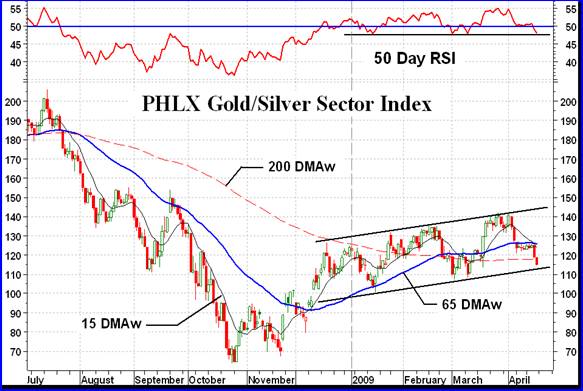
The PHLX Gold/Silver Sector Index is probably the best known of the major North American gold Indices. It is presently at a very interesting juncture. Although both silver and gold have a bullish downward sloping flag pattern this Index has an upward sloping one. It could more realistically be called an upward sloping channel. Unfortunately, these upward sloping channels have a habit of the price breaking below its lower support line for a bearish break. The Index is sitting almost on top of the support line. The Index itself is below its negative sloping intermediate term moving average line and the intermediate term momentum indicator is now in its negative zone below its negative trigger line. Everything here suggests that we are in for more down side action ahead although there still is a slime possibility of a bounce off the support line.
This does not portent well for gold and silver stocks. It is best to hold off any purchases until the dust settles and we have some indication that the up side is once more in play. Otherwise, any purchases must be seen as having a greater degree of risk involved.
As a comparison, my own comparative Index, the Merv’s Qual-Gold Index, has already moved into new lows below the February level. About the only differences between the ratings of the Merv’s Indices and the major North American Indices is in the long term time frame where the Merv’s Indices have not yet started to show a concern.
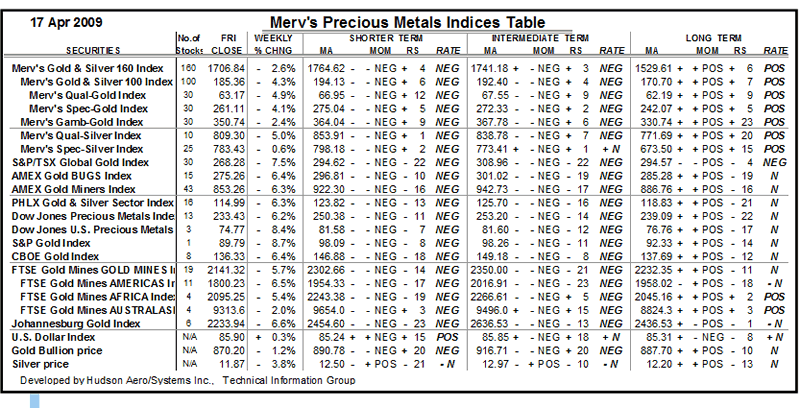
Merv’s Precious Metals Indices Table
Well, that's it another week.
By Merv Burak, CMT
Hudson Aero/Systems Inc.
Technical Information Group
for Merv's Precious Metals Central
For DAILY Uranium stock commentary and WEEKLY Uranium market update check out my new Technically Uranium with Merv blog at http://techuranium.blogspot.com .
During the day Merv practices his engineering profession as a Consulting Aerospace Engineer. Once the sun goes down and night descends upon the earth Merv dons his other hat as a Chartered Market Technician ( CMT ) and tries to decipher what's going on in the securities markets. As an underground surveyor in the gold mines of Canada 's Northwest Territories in his youth, Merv has a soft spot for the gold industry and has developed several Gold Indices reflecting different aspects of the industry. As a basically lazy individual Merv's driving focus is to KEEP IT SIMPLE .
To find out more about Merv's various Gold Indices and component stocks, please visit http://preciousmetalscentral.com . There you will find samples of the Indices and their component stocks plus other publications of interest to gold investors.
Before you invest, Always check your market timing with a Qualified Professional Market Technician
Merv Burak Archive |
© 2005-2022 http://www.MarketOracle.co.uk - The Market Oracle is a FREE Daily Financial Markets Analysis & Forecasting online publication.