


Stock Market Counter Trend Rally Ending Within Bear Market
Stock-Markets / Stocks Bear Market Apr 19, 2009 - 05:41 PM GMTBy: Andre_Gratian

 Current Position of the Market
SPX: Long-term trend - Down! The very-long-term cycles have taken over and if they make their lows when expected, the bear market which started in October 2007 should continue until 2012-2014. This would imply that much lower prices lie ahead.
SPX: Intermediate trend - The index has started a counter-trend rally of a corrective nature. The "A" part of that correction could have come to an end this past Friday.
Analysis of the short-term trend is done on a daily basis with the help of hourly charts. It is an important adjunct to the analysis of daily and weekly charts which determines the course of longer market trends.
Daily market analysis of the short term trend is reserved for subscribers. If you would like to sign up for a FREE 4-week trial period of daily comments, please let me know at ajg@cybertrails.com .
Overview:
I am becoming more and more convinced that since the May 6th 667 low, we are in a corrective rally -- probably of an A-B-C nature -- and it looks as if the "A" wave came to an end this past Friday. This is based on the position of the indicators vs. price that we will examine on the charts later on. This is our first "real" bear market rally (probably intermediate wave 4) since the beginning of the downtrend from October 2007, and it gives every indication of lasting a few more weeks. The total bear market will last so long that future analysts may argue whether it was one long bear market, or two consecutive ones. Whatever it will be called in retrospect, we are approximately one third of the way through the whole process.
If this is correct, the entire decline could take the form of a giant zig-zag, the first one ending toward the end of this year or early next, followed by a very large corrective wave lasting over a year, and then the second "bear market" starting in 2011. It's better to have a scenario in mind than none at all and, based on Cycles and Elliott Wave, this is at least a plausible one. It will be interesting to see if it turns out to be correct.
Looking beyond the stock market and the economy, we have entered an accelerated period of universal cleansing which comes periodically as a necessity for man's natural evolution. The human race cannot move forward without getting rid of many of the beliefs that shaped the past, and this process normally takes place gradually and smoothly. But when we fall too far behind by trying to hang on to the old ways carried to excess, at some point Nature says "Enough, time to move on!" This is what human history teaches us repeatedly, and those who cannot, or will not, grasp this self-evident concept are the ones who suffer the most during the transition period. Nature seeks balanced progress. Mankind has a tendency to resist it!
Balance is what the stock market seeks as well but seldom finds, and this is why it is always in a state of flux --short, intermediate and long term. Some of the best indicators are those that show when investors feel the market is overbought or oversold, in any time frame, and starts to lose momentum.
What's ahead?
Chart Pattern and Momentum
Momentum is the key word! When loss of momentum occurs, more and more investors are realizing that an index (stock, commodity...) has gone too far in one direction or the other -- in any time frame. More and more of them stop buying or selling while those who have a contrary opinion do the opposite. This creates deceleration in the price which is most visible in oscillators, and this is how we are warned that a reversal is about to take place.
But one can also see this coming just by looking at the price chart. On the weekly chart of the SPX which follows, I have drawn the channel which best represents the current phase of the total bear market. Now, look at the congestion level which exists between 850 and 950. A battle was fought there between the investors who felt the market had gone far enough and those who thought it would go farther. The latter won, and the market dropped some more. But as we went below 740, there was less trading. The index bounced back quickly because investors began to feel that it was oversold, and prices were at a bargain. Note also that price did not go all the way to the bottom of the channel, but started reversing before it got there, another sign of deceleration!
As for the oscillators, they failed to go anywhere close to their lows as the price went lower and created glaring positive divergence which announced a turn in the market.
Now, let's say that the market begins to decline: do you see any sign of divergence in the indicators? Nope! So the odds strongly favor that if we do pull back (which is very probable because the overbought/oversold indicator is extremely overbought), it will simply be a correction in an uptrend and not the end of it. This is why I have labeled this as wave "A".
We can see better why we should have a correction at this point on the daily chart. There is negative divergence in all the indicators, and several cycles are bottoming directly ahead of us. We are also at resistance caused by a former high and a parallel to the channel lines.
There are other reasons that we will discuss later, but let's move on to the hourly chart for shorter-term analysis.
The price has been decelerating since 3/26, but it has also continued to move up from 3/30 in a wedge formation. The wedge now appears to have 5 complete waves, and the entire move from 667 is probably a corrective a-b-c pattern which is the first leg of the intermediate wave 4 discussed earlier. The fact that the middle (momentum) oscillator still does not show negative divergence offers the very unlikely possibility that we may have one more high before beginning a decline and breaking out of the wedge. But since negative divergence is present in the other two -- and particularly well-accented in the lower (A/D) oscillator -- this strongly favors Friday as a short-term top.
We don't know yet, exactly how much of a correction we are going to have, but it should be to a level below the bottom of the black channel, at a minimum. 784 would be a good target followed by 770 if the decline continues.
Cycles
The Armstrong cycle was obviously a top, and since it was slated to come between the 16th and the 19th, the 17th fits right in!
The other cycles lying directly ahead are clearly shown on the chart. The only ones that are not are those which constitute a cluster forming about 5/1.
Projections:
I had a long-standing projection to 860 for this rally, but as strength continued to be apparent and the pattern appeared incomplete, this is what I wrote to my subscribers on Friday morning in my Morning Comment:
----- Original Message -----
From: Andre Gratian
Sent: Friday, April 17, 2009 6:12 AM
Subject: Morning CommentFriday, April 17 Morning Comment
In yesterday's chart update, I mentioned that there was a possibility that we were not "quite" there, yet! This appears to be confirmed by the futures which are opening flat this morning. Had they gapped down, it would have meant that it was all over. We'd now better bring to the fore the potential 875-78 projection which had been placed on the back burner in yesterday's morning comment...
I don't want to get too picky, but note that we stopped at 875.63 and that there is no negative divergence on the hourly momentum oscillator. Moving to 878 is still a possibility!
Breadth
As pointed out in previous newsletters, the summation index had positive divergence when the SPX made its low at 667. It has since made a new recovery high, which is one indication that the intermediate trend is still up.
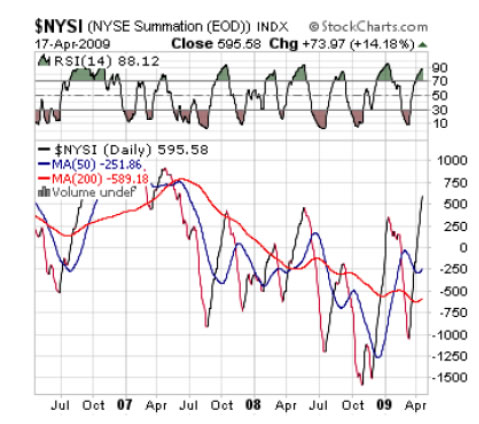
By contrast, both the daily and hourly charts show negative divergence, which should point to a short-term top.
Market Leaders and Sentiment
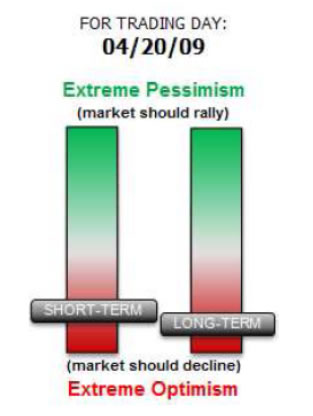
We need not go beyond the sentiment indicator (courtesy of Sentimentrader) to reinforce the notion that we are at some sort of a top. What a difference 2 weeks made!
Summary
There is plenty of evidence that the SPX is at the end of a short-term trend.
There is also evidence that this could be wave "A" of corrective intermediate wave (4) before we finish the primary decline from October '07.
The following are examples of unsolicited subscriber comments:
Awesome calls on the market lately. Thank you. D M
Your daily updates have taken my trading to the next level. D
… your service has been invaluable! It's like having a good technical analyst helping me in my trading. SH
I appreciate your spot on work more than you know! M
But don't take their word for it! Find out for yourself with a FREE 4-week trial. Send an email to ajg@cybertrails.com .
By Andre Gratian
MarketTurningPoints.com
A market advisory service should be evaluated on the basis of its forecasting accuracy and cost. At $25.00 per month, this service is probably the best all-around value. Two areas of analysis that are unmatched anywhere else -- cycles (from 2.5-wk to 18-years and longer) and accurate, coordinated Point & Figure and Fibonacci projections -- are combined with other methodologies to bring you weekly reports and frequent daily updates.
“By the Law of Periodical Repetition, everything which has happened once must happen again, and again, and again -- and not capriciously, but at regular periods, and each thing in its own period, not another’s, and each obeying its own law … The same Nature which delights in periodical repetition in the sky is the Nature which orders the affairs of the earth. Let us not underrate the value of that hint.” -- Mark Twain
You may also want to visit the Market Turning Points website to familiarize yourself with my philosophy and strategy.www.marketurningpoints.com
Disclaimer - The above comments about the financial markets are based purely on what I consider to be sound technical analysis principles uncompromised by fundamental considerations. They represent my own opinion and are not meant to be construed as trading or investment advice, but are offered as an analytical point of view which might be of interest to those who follow stock market cycles and technical analysis.
Andre Gratian Archive |
© 2005-2022 http://www.MarketOracle.co.uk - The Market Oracle is a FREE Daily Financial Markets Analysis & Forecasting online publication.