


Markets Are a Mixed Bag ETF Attributes: Part 2a - iShares Bonds
Stock-Markets / Exchange Traded Funds Apr 20, 2009 - 07:39 AM GMTBy: Richard_Shaw

 In Part 1, we examined Vanguard bond and stock ETFs. In this Part 2a, we look at iShares bond funds with 12 or more months of distribution data (plus their preferred stock fund).
iShares is the largest ETF provider. Their ETFs differ importantly from Vanguard’s in two important ways.
First, iShares uses sampling and derivatives to achieve the returns of the indexes they track, versus Vanguard which uses a replication or very high sample rate approach (e.g. iShares AGG has 175 holdings and Vanguard BND has 3,903 holdings, yet both seek to track the same index).
Second, iShares ETFs are independent portfolios, while Vanguard uses a “master/feeder” structure. That means Vanguard mutual funds and ETFs share a common master portfolio, and the ETFs and mutual funds are different “feeder” funds that invest in bulk in the corresponding master fund (that helps control costs).
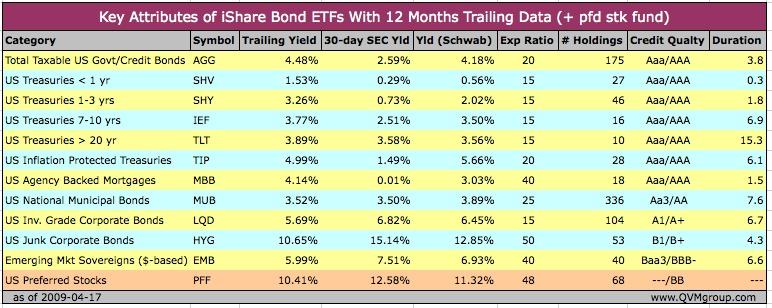
The table provides the yield, expense ratio, number of holdings, credit quality, and effective duration of each fund. In addition, we list three different yield figures (and there are others). We show (1) the 12-month trailing income distributions divided by the current price, (2) the SEC 30-day yield, and (3) the “annual dividend yield” as reported by Schwab, which they get from Morningstar.
There is a fourth type of yield not reported in the table, called “distribution yield”. Here is how Morningstar calculates that:
Distribution Yield is the Trailing 12-Month End Yield - Morningstar computes this figure by summing the trailing 12-month’s income distributions and dividing the sum by the last month’s ending Net Asst Value (NAV), plus capital gains distributed over the same time period. Income refers only to interest payments from fixed-income securities and dividend payments from common stocks.
That’s too complicated for our purposes, It is also not current to the day, but only to the ETF net asset value (do they use price for ETFs?) as of the end of the last month.
Our trailing yield calculation is simpler, because it is all income distributions over the past 12-months divided by the market price as of the date of the calculation. That doesn’t make it better, just easier for us to conceptualize.
There is a specialized fifth yield type called “real yield”, which is used for inflation protected bonds. The real yield is the what the bond pays net of the CPI increment to yield. The term has long been used to describe rates. The real interest rate is the nominal interest rate minus inflation.
Then there is yield to maturity and yield to worst, and probably more varieties that bond professionals use that we don’t know about.
This discussion of yield is not provided to confuse you, but to point out that just as “earnings” for stocks have numerous definitions which are seldom noted when the “E” figure is tossed about; the “yield” for bond funds also has numerous definitions which are seldom noted when the “Y” figure is tossed about.
Sometimes one method makes more sense than the other, but it requires an awareness of the method differences and something about the character of the underlying portfolio holdings.
For example, the SEC 30-day yield is probably a good fund-to-fund comparator if both funds own monthly interest bonds, or so many bonds that the income is received smoothly through the year.
However, if a fund receives interest on an irregular basis or or at intervals longer than monthly, the SEC yield can vary widely from month-to-month. To be simplistic, if a fund owned all semi-annual payment bonds, and they all had the same payment dates, the fund would have a zero SEC yield in 10 of 12 months, and an enormously overstated yield in 2 of 12 months. That problem arises because the SEC yield is simply the sum of the receipts in the past 30 days annualized.
The distribution yield and 12-month trailing yield suffer from changing rates. For example, a bond fund with substantial inflows and outflows or high turnover would have a misleading distribution or trailing yield if rates changed significantly. Take the example of the extremely short maturity SHV (duration about 4 months). It would be essentially useless to know the 12-month trailing in a period where rates fell from say 3% to 0.25% over the course of the year.
Bottom line — it’s not a great idea to just take yield figures at face value from some website or even the fund fact sheets when planning or reviewing your portfolio. A little understanding of how the yields are calculated will go a long way. It is also inappropriate to compare yields on funds without also knowing about the duration, credit quality and other factors to differentiate your opportunities and risks.
By Richard Shaw
http://www.qvmgroup.com
Richard Shaw leads the QVM team as President of QVM Group. Richard has extensive investment industry experience including serving on the board of directors of two large investment management companies, including Aberdeen Asset Management (listed London Stock Exchange) and as a charter investor and director of Lending Tree ( download short professional profile ). He provides portfolio design and management services to individual and corporate clients. He also edits the QVM investment blog. His writings are generally republished by SeekingAlpha and Reuters and are linked to sites such as Kiplinger and Yahoo Finance and other sites. He is a 1970 graduate of Dartmouth College.
Copyright 2006-2009 by QVM Group LLC All rights reserved.
Disclaimer: The above is a matter of opinion and is not intended as investment advice. Information and analysis above are derived from sources and utilizing methods believed reliable, but we cannot accept responsibility for any trading losses you may incur as a result of this analysis. Do your own due diligence.
Richard Shaw Archive |
© 2005-2022 http://www.MarketOracle.co.uk - The Market Oracle is a FREE Daily Financial Markets Analysis & Forecasting online publication.