


When Will the Economy Recover from Recession?
Economics / Recession 2008 - 2010 May 03, 2009 - 07:37 AM GMT

 Standard & Poor’s: S&P/Case-Shiller - home prices still declining “Data through February 2009, released today [Tuesday] by Standard & Poor’s for its S&P/Case-Shiller Home Price Indices shows continued broad based declines in the prices of existing single family homes across the United States, with 10 of the 20 metro areas showing record rates of annual decline, and 15 reporting declines in excess of 10% versus February 2008. For the first time in 16 months, however, the annual decline of the 10-City and 20-City composites did not set a new record.
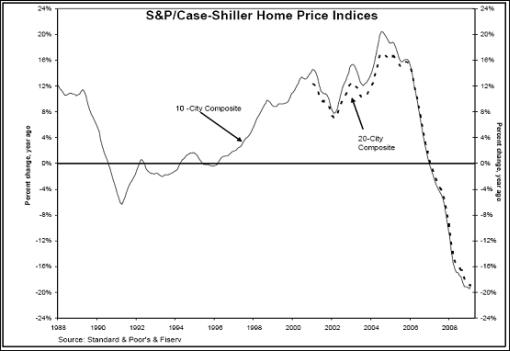
“The chart above depicts the annual returns of the 10-City Composite and the 20-City Composite Home Price Indices. The 10-City and 20-City Composites recorded annual declines of 18.8% and 18.6%, respectively. This is a slight improvement from their returns reported for January, where they fell by 19.4% and 19.0%, respectively.
“‘While the declines in residential real estate continued into February, we witnessed some deceleration in the rate of decline in some of the markets,’ says David Blitzer, Chairman of the Index Committee at Standard & Poor’s.”
Click here for the full report.
Source: Standard & Poor’s, April 28, 2009.
Asha Bangalore (Northern Trust): Consumer spending and income decline “Personal income fell 0.3% in March following a 0.2% drop in February. Personal income has declined in five out of the last six months. It is more troubling to note that personal income on a year-to-year basis grew only 0.3% during March, the smallest gain since 1959 when record keeping began for this series.
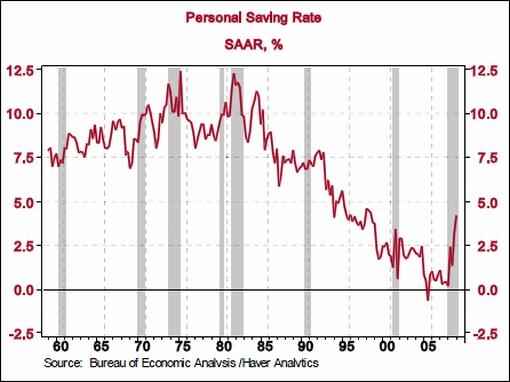
“Consumer spending, after adjusting for inflation, fell 0.2% in March after upwardly revised gains of 0.9% and 0.1% in January and February, respectively. In light of the absence of support from income, a setback to consumer spending in the near term is almost certain. In the meanwhile, personal saving as a percent of disposable income increased to 4.2% in March from 4.0% in February, putting the quarterly average at 4.2%, the largest average seen since the third quarter of 1998.”
Source: Asha Bangalore: Northern Trust - Daily Global Commentary, April 30, 2009.
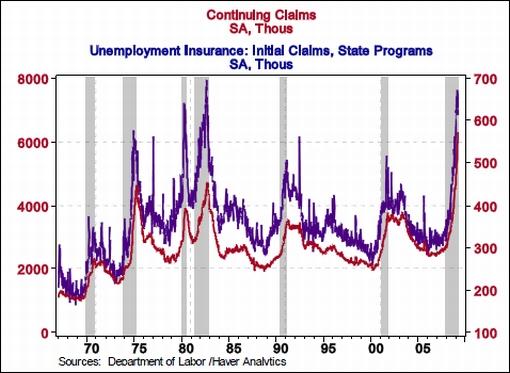
Asha Bangalore (Northern Trust): Initial jobless claims declined but continuing claims advanced “Initial jobless claims fell 14,000 to 631,000 during the week ended April 25, marking the third weekly decline in the last four weeks. The four-week moving average appears to have peaked in the week ended April 4.
“Continuing claims, which lag initial claims by one week, rose 133,000 to a new record high of 6.271 million and the insured unemployment rate advanced to 4.7% from 4.6% in the prior week.”
Source: Asha Bangalore: Northern Trust - Daily Global Commentary, April 30, 2009.
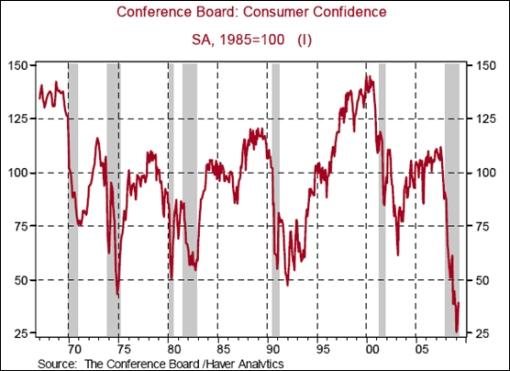
Asha Bangalore (Northern Trust): Consumer Confidence Index improves mostly on surge in expectations index “The Conference Board’s Consumer Confidence Index shot up 12.3 points to 39.2 in April. The Present Situation Index moved up only 1.8 points to 23.7, while the Expectations Index increased 19.3 points to 49.5.”
Source: Asha Bangalore, Northern Trust - Daily Global Commentary, April 28, 2009.
The American Banker: Credit card losses “Credit card losses suddenly escalated in the first quarter as unemployment and other economic conditions worsened, spooking issuers to the point where most shied away from forecasting losses beyond the near term.”
Source: The American Banker, April 29, 2009.
Rasmussen Reports: 26% say US already has partially socialist economy “Twenty-one percent (21%) of American adults say that the US economy is partially socialist and another five percent (5%) say generally speaking it’s already a socialist economy.
“A new Rasmussen Reports national telephone survey found that 26% believe the United States generally has a free market economy and that 41% say the country has a partially free market economy.
“Seventy-seven percent (77%) of all voters say they prefer a free market economy over a government-managed one. That’s up seven points since December.
“But only 53% of American adults believe capitalism is better than socialism. This clearly suggest that many Americans draw a sharp distinction between capitalism and a free market economy.
“Belief that the United States has a free market economy generally rises with income level. Those who earn the most are most confident that the market is at least partially free.”
Source: Rasmussen Reports, April 28, 2009,
Financial Times: Commercial mortgages at risk “The volume of commercial mortgages at risk of default has quintupled since the beginning of 2008 as a deteriorating economy has made it increasingly difficult for shops and businesses to keep up with their payments.
“Special servicers, companies that collect payments from borrowers in distress on behalf of mortgage bond investors, reported $23.7 billion of mortgages under their care at the end of the first quarter, according to Fitch Ratings.
“That was five times higher than the $4.6 billion of mortgages needing special servicing at the end of 2007. Servicers experienced an almost 50% increase in the volume of distressed commercial mortgages in the first quarter alone.
“Mortgages for multi-family residential properties suffering from the housing downturn represented the largest share of the troubled loans at 31%, said Fitch. However, mortgages for shops and businesses were catching up, with retail loans at 28% of the distressed pools.
“Fitch analysts said they expect commercial mortgage defaults to continue to increase this year. At the end of the first quarter, defaults and payments more than 60 days late were at 1.53% of outstanding mortgages. Fitch said they could reach 4% by the end of 2010.”
Source: Saskia Scholtes, Financial Times, April 28, 2009.
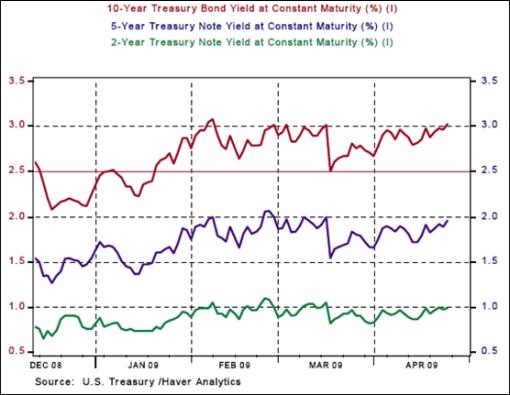
Asha Bangalore (Northern Trust): 10-year Treasury Note yield and mortgage rates after March 18, 2009 “The March 18 FOMC policy statement noted the following:
‘To provide greater support to mortgage lending and housing markets, the Committee decided today to increase the size of the Federal Reserve’s balance sheet further by purchasing up to an additional $750 billion of agency mortgage-backed securities, bringing its total purchases of these securities to up to $1.25 trillion this year, and to increase its purchases of agency debt this year by up to $100 billion to a total of up to $200 billion. Moreover, to help improve conditions in private credit markets, the Committee decided to purchase up to $300 billion of longer-term Treasury securities over the next six months.’
“The 10-year Treasury note yield closed at 2.51% on March 18, reflecting a 51 bps rally compared with the close on March 17, 2009, and has since held above the March 18 reading. The 10-year Treasury note yield on April 24 was 3.03% and as of this writing it was trading around 2.97%.
“The Fed has purchased $73.742 billion of Treasury securities between March 23, 2009 and April 27, 2009. The chart below indicates the Fed has not succeeded in guiding Treasury securities lower after the announcement. The goal of the purchase program is to buy $300 billion of longer-term Treasury securities over a six-month period. Effectively, the Fed has roughly $226 billion of Treasury securities more to purchase under this program.
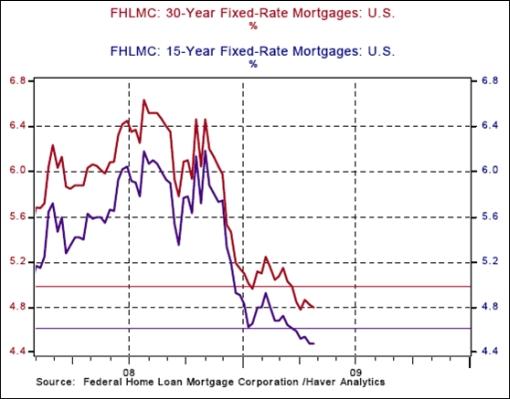
“The good news is that mortgage rates have declined further after the Fed expanded the purchase of mortgage-backed securities ($1.25 billion, up from prior announcement of $750 billion) and agency debt ($200 billion, up from earlier plan of $100 billion) as per the March 18 announcement. The 30-year mortgage rate stood at 5.03% during the week ended March 20 and was quoted at 4.80% as of April 24.”
Source: Asha Bangalore, Northern Trust - Daily Global Commentary, April 27, 2009.
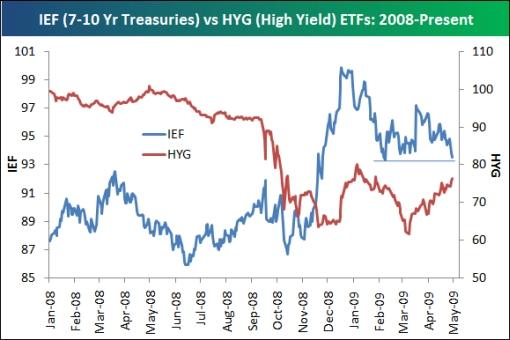
Bespoke: Treasuries and high-yield bonds converge “IEF is an ETF that tracks the price of long-term Treasuries (7-10 years), while HYG tracks the price of high-yield (junk) bonds. During the flight to safety panic that occurred in late 2008, Treasuries soared (yields fell), while junk bonds tanked (yields rose). This caused high-yield spreads to spike to levels not seen in decades. As the market has regained some of its footing in the last couple of months, however, spreads have begun to come in, and the price charts of IEF and HYG highlight this convergence. As shown, IEF (Treasuries) are getting close to testing February support, and the ETF is down from more than $100 to the low $90s. HYG, on the other hand, has rallied from the low $60s to the high $70s since the March equity market lows. If IEF breaks this support in the coming days, it will probably be a sign that the current trend will continue on for longer.”
Source: Bespoke, April 30, 2009.
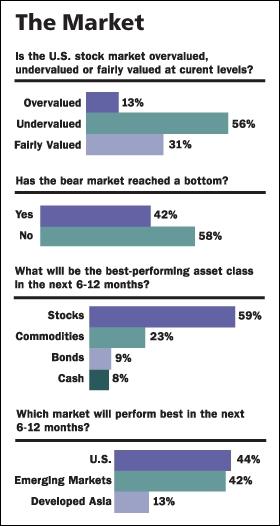
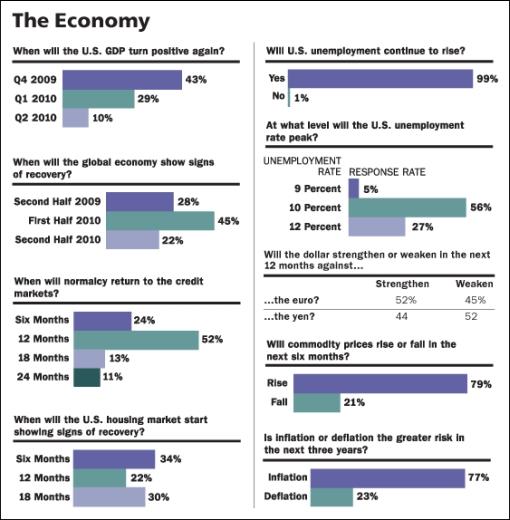
Barron’s: Big money poll - the long view “After the worst stretch for stocks in decades, America’s money managers say they’re bullish. But do they really believe it? Based on the results of our latest Big Money poll, the pros are hoping for the best, but … hold on! Aren’t those fresh bear tracks in the mud?
“Nearly 60% of our respondents call themselves bullish or very bullish about the stock market’s prospects through the end of 2009, a significant increase from the 50% who proclaimed themselves bulls last fall. Yet, signs of unease abound. For one, just 56% of today’s poll participants think the stock market is undervalued, down from 62% last fall. Thirteen percent say stocks are overvalued, up from a prior 7%. And an alarming 58% say the market hasn’t bottomed yet, even though the Dow Jones industrials hit a low of 6,469 in March, before recovering to a recent 8,100.
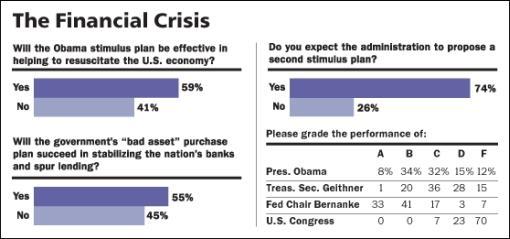
“The managers are similarly wary about the outlook for the economy, at least through the end of this year. And they are downright doubtful that the government’s first stimulus package, announced with fanfare shortly after the Obama administration moved into the White House, will be the last.
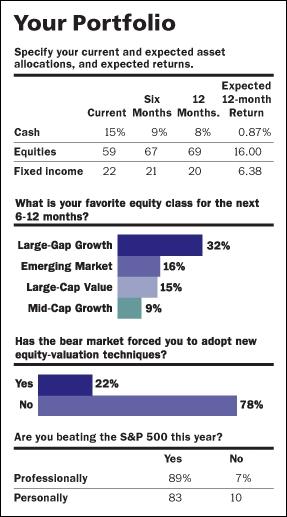
“Given these and other concerns, only 26% of the Big Money men and women expect to be net buyers of stocks in the next six months, although 66% say they will be putting more money to work in the 12-month span. But don’t look for fresh dough to flow solely to US equities. Just 44% of our respondents think the US will be the strongest market in the next year; 42% expect emerging markets to take the baton and lead. As Keith Wibel, a money manager at Foothills Asset Management in Scottsdale, Ariz., put it, ‘Confidence has been fractured. The psyche is slow to heal.’
“The market isn’t much faster. Big Money’s bullish cohort expects the Dow to end 2009 at 8,676, about 7% above current levels but flat for the year. Things, or at least stocks, will pick up thereafter, with the blue chips rising another 10% or so, to 9,488, by mid-2010. In concert with their short-term-skittish, long-term-sunny stance, more than 40% of bulls predict the Dow industrials will reach or breach 10,000 by the middle of next year.
“The optimists see the Standard & Poor’s 500 jogging to 906 by December 30, en route to 1,003 next June. The popular benchmark closed Friday at 866. Their mean predictions for the Nasdaq Composite: 1,683 by year end, and 1,841 by mid-2010, up from last week’s 1,694.
“Some big money managers are notably upbeat even - or especially - after a global financial meltdown has cut most stock indexes in half. ‘They don’t ring a bell when they announce a sale on Wall Street, but prices are as good as I’ve seen them in my entire career,’ says David Corbin, president of Corbin & Co. in Fort Worth, Texas.”
Source: Jack Willoughby, Barron’s, April 27, 2009.
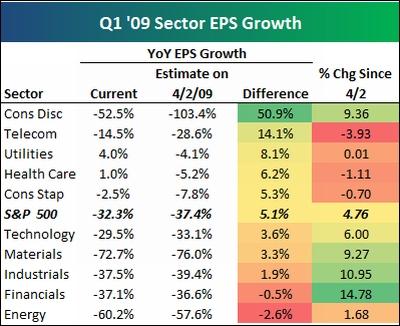
Bespoke: Sector earnings growth in the first quarter “More than 70% of the companies in the S&P 500 have now reported first quarter earnings, so the growth puzzle for the quarter is beginning to take shape. Below we highlight the current year over year % change in earnings for Q1 ‘09 versus Q1 ‘08. We also provide the estimates for these numbers as they stood just before earnings season began.
“As shown, the S&P 500 is currently seeing earnings decline by 32.3% in the first quarter. At the start of earnings season, this number was estimated at -37.4%, so it’s coming in a little better than expected. Consumer Discretionary looks the best when comparing actual versus estimates, but earnings have still declined by 52.5% in the sector. The only two sectors that are coming in weaker than expected are Financials and Energy.
“We also provide the price performance of the sectors since April 2nd. Interestingly, most of the sectors that are up the most are the worst in terms of actual earnings versus estimates.”
Source: Bespoke, May 1, 2009.
David Fuller (Fullermoney): Will stock markets stay above March lows “The important question is whether or not Wall Street continues to range above its March lows? The answer will have significant implications for other stock markets.
“At Fullermoney, we maintain that the S&P 500 Index will most likely hold above its March low, as it continues to develop a base formation. The main reason, previously stated, is that we are witnessing the greatest attempt at asset reflation in human history. In comparison, it makes Greenspan look, well … almost Austrian and the USA is certainly not the only country engaged in a record reflation. The secondary reason is the record levels of cash held by institutional investors.
“Let us now consider three scripts for Wall Street and its implications for other stock markets: 1) the S&P keeps on rallying, surprising even the bulls; 2) the S&P ranges in extended base formation development for many more months; 3) the S&P rolls over and resumes its bear market by moving well beneath the March low.
1) In this event, the stock markets and sectors that are already considerably outperforming the S&P - mainly Fullermoney themes, including China-led emerging Asia, South American-led resources markets and technology - will continue to do much better than the S&P. Other OECD stock markets, (tech & telecom weighted Sweden excepted), will track the S&P, albeit usually with a slightly higher beta.
2) The Fullermoney themes in (1) above outperform, extending their ranging upward trends. Most OECD stock markets track Wall Street.
3) Fullermoney themes fall back and extend their base formations. Most OECD stock markets track Wall Street, with Sweden being the most likely exception.
“What do I expect? I think it will be (2) above, although possibly in combination with (1). I will not worry too much about (3), provided the S&P can maintain approximately half of its gains from the March low during the next reaction phase.”
Source: David Fuller, Fullermoney, April 29, 2009.
David Fuller (Fullermoney): Global stock markets leaders - what are they saying? “Fullermoney has long maintained that the leaders lead in both directions. In other words, the leaders of a global stock market recovery will usually lead the next correction. The same applies in reverse.
“Which are the leaders and what are they indicating today?
“China is one of the few stock markets capable of providing a leash effect. Among bigger capitalisation markets, it has led on the upside since its October 2008 low. We pointed out China’s downside key day reversal on April 22 and it is experiencing downside follow through, indicating susceptibility to a further pullback. This will probably create another buying opportunity and I would only be concerned if the last reaction low near 2,040 was exceeded. Meanwhile, it will take an upward dynamic to check this reaction beyond a brief pause.
“Taiwan is a China satellite, strong on tech, which has once again been a leading sector. Consequently Taiwan has been an outstanding performer, that is until its downside key day reversal on April 17. This occurred near the psychological 6,000 level and we saw another downward dynamic today. A close above 6,100 is currently required to offset scope for an additional reaction.
“Brazil has been South America’s comparatively big-cap leader among these resources markets, often cited by Fullermoney. It shows none of the downside keys or other bearish dynamics and actually reached a new high on Friday, although that gain was not maintained today. A close under 44,270 would confirm an upside failure and susceptibility to an additional short-term reaction.
“Conclusion - Fullermoney anticipated the impressive global stock market rally, not least with the help of indices shown above, plus other regional leaders such as Sweden, which is still appreciating, albeit approaching lateral and psychological resistance near 800. We remain medium-term bullish but would be cautious in the short term.
“We have always spoken of a lengthy convalescence in response to the financial crisis. Consequently we have favoured accumulating equities on easing within this base building phase and early stage uptrends among the leaders.
“Meanwhile, there is still more than enough worrying news, in terms of corporate disappointments, to frighten buyers from time to time. Conversely, there is more than enough cash on the sidelines to cushion downside risk during the inevitable reactions and consolidations. For OECD laggards which experienced March lows, I would be concerned if they gave up more than half of their gains from those lows during a reaction.”
Source: David Fuller, Fullermoney, April 27, 2009.
Richard Russell (Dow Theory Letters): Lowry’s statistics do not favor a new bull market “The Lowry’s statistics do not favor the argument that a new bull market has started. Normally, based on the long history of the Lowry’s studies, when a new bull markets starts, their Buying Power and Selling Pressure Indices move apart by roughly the same number of points.
“The fact - since the March 9 low, Lowry’s Buying Power Index has gained 57 points, but their Selling Pressure Index has only dropped 20 points. This is at sharp variance with all other bull market starts in the Lowry’s history.
“Basically, when a new bull market starts, the background is that the urge to sell has been exhausted. The pressure to press that market down further has disappeared. Thus, the market is left in the hands of those who wish to buy. In the current case, there is still a potential supply of stocks to be sold. In other words, the situation is not correct for the start of a new bull market, based on 76 years of the Lowry’s data.”
Source: Richard Russell, The Dow Theory Letters, March 31, 2009.
Bespoke: Mid-April short interest “Short interest figures as of mid-April were released on Friday after the close and showed an overall decrease in short interest for NYSE and Nasdaq listed stocks. In the chart below, we show the average short interest as a percentage of float for S&P 500 stocks. After peaking at 5.6% in mid-March, short interest as of mid-April has now declined to 5.5% of the average stock’s float.
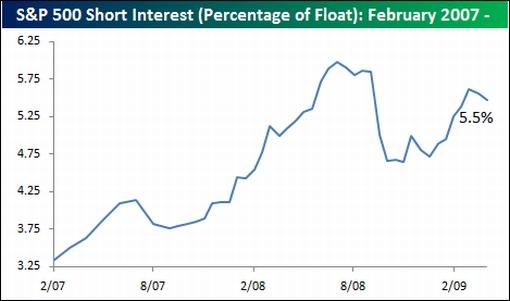
“At first glance, it is somewhat surprising that short interest has only declined by a marginal amount. Given the 25%+ rally in the S&P 500, one would expect to see short interest decline by a much larger amount. Digging into these numbers, however, the headline short interest numbers are somewhat misleading due to the extraordinarily large short interest in Citigroup (C). Due to the arbitrage taking place over the upcoming conversion of the preferred into common shares, Citi’s short interest represents 12.1% of the total short interest for the S&P 500. If one were to back Citi out of the calculations, short interest would be about 5.4% of the average stock’s float.
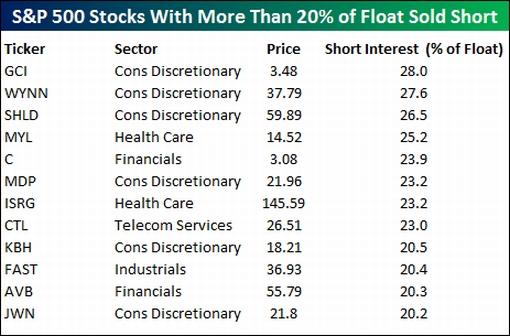
“Even though short interest has declined, there are still plenty of stocks investors are heavily betting against. For example, 82 stocks in the S&P 500 currently have over 10% of their float sold short, and 12 have more than 20% shorted. Given the state of the Financials, one would think most of the names would come from that sector, but the reality is that Citigroup (C) and Avalon (AVB) are the only two names from that sector to make the list. The Consumer Discretionary sector is currently the most popular on the “least popular” list (more than 20% sold short), as six of the 12 names are from the sector.”
Source: Bespoke, April 27, 2009.
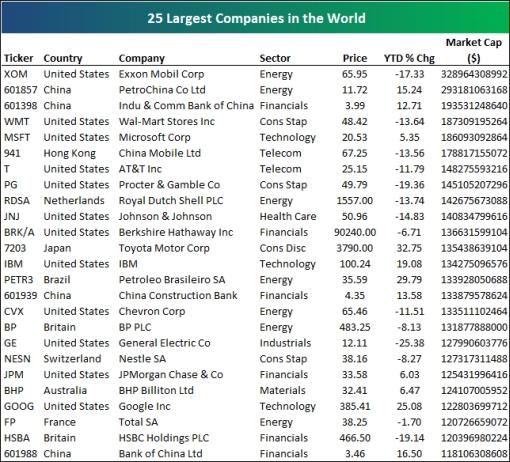
Bespoke: Largest companies in the world “… below we highlight the 25 largest companies in the world. For each company, we provide its country, sector, price (local currency), year to date change, and market cap in dollars. As shown, Exxon Mobil (XOM) is the biggest company in the world and the only one worth more than $300 billion. PetroChina ranks second and is the only other company worth more than $200 billion. The Industrial and Commercial Bank of China is the world’s third largest company, giving China two of the biggest three. Wal-Mart and Microsoft round out the top five. The United States still dominates the list with 12 of the 25 spots. China ranks second with four spots. General Electric used to be the biggest company in the world, but it has slipped all the way down to the 18th spot. Google (GOOG) is also on the list at number 22.”
Source: Bespoke, April 27, 2009.
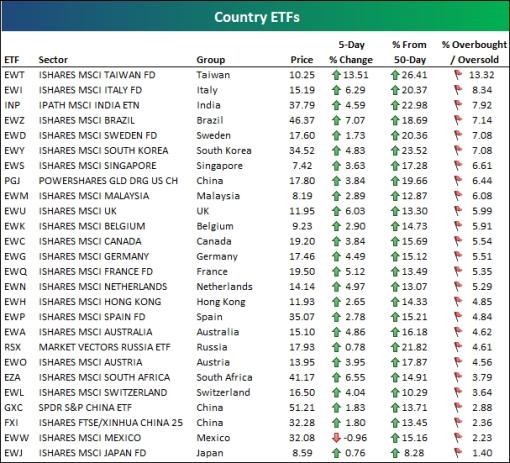
Bespoke: Country ETFs overbought “… we highlight below various country ETFs and their current trading levels. An ETF becomes overbought when it trades more than one standard deviation above its 50-day moving average. The % overbought number is how far the ETF is currently above this initial overbought level. This is the first time in quite awhile that all country ETFs have been overbought at the same time, and it’s a sign that markets around the world are extended from their normal trading ranges. The Taiwan ETF is the most overbought at 13.32%, followed by Italy (8.34%), India (7.92%), Brazil (7.14%), Sweden (7.08%), and South Korea (7.08%). Japan is the least overbought at 1.4%.”
Source: Bespoke, April 30, 2009.
The Wall Street Journal: The IMF’s gold gambit “The fund’s misuse of bullion reserves is crucial to its plan to use the financial crisis to expand its power.
“The International Monetary Fund (IMF) deserves credit, figuratively speaking, for cleverly manipulating the financial troubles of emerging and low-income nations to procure a fresh infusion of capital for itself. But its tactics at this month’s G-20 summit in London - where President Barack Obama signed off on tripling the IMF’s lending resources - should not hoodwink anyone, least of all American taxpayers who pay the largest share of IMF expenses.
“Lost in the lofty talk about putting the IMF in the center of world economic recovery is the fact that the organization has been quietly attempting to ensure its own survival by seeking permission to engage in gold sales …
“The US should not replenish the coffers of a multilateral bureaucracy that quite literally lost its reason for being on August 15, 1971 - the day President Richard Nixon ‘closed the gold window’ and brought an end to the Bretton Woods agreement, which allowed countries to convert their dollar holdings, via the IMF, into gold at a fixed price. Instead, Congress should call for the IMF’s dismantlement and restitution of its assets.
“The most solid asset owned by the IMF, purely as a legacy of its original incarnation, is gold. The IMF holds 3,217 metric tons (103.4 million ounces) of gold, which makes it the world’s third largest official holder. Actually, it’s a misnomer to say the IMF ‘owns’ the gold since the bullion belongs, according to the IMF articles of agreement adopted at Bretton Woods in 1944, to its member nations.”
Source: Judy Shelton, The Wall Street Journal, April 28, 2009.
Julian Jessop (Capital Economics): China’s gold reserves jump “The revelation of a jump in China’s official gold holdings to 1,054 metric tonnes is supporting gold prices and reviving fears that reserve diversification will undermine other dollar assets, notably US Treasuries.
“But the news may be less significant than some people think, says Julian Jessop, chief international economist at Capital Economics.
“‘Gold was in a bull market from 2002 to 2008, so it is no great surprise that China was buying over this period. The reported amounts are also small compared to the production from China’s own mines, official sales by other central banks, and the record purchases by private investors via exchange traded funds,’ he notes.
“‘What’s more, the fact that China has already increased its gold holdings by 75% does not necessarily mean further purchases and higher prices in the future. It would make more sense to announce an increase in gold holdings once a buying programme has been completed, rather than part way through.
“‘We are also sceptical that the increase in gold holdings tells us anything about the plans for purchases of other assets. Even if all of the additional gold were bought last year at the average 2008 price of $872 an ounce, the total cost would only be around $12.6 billion. This is just a drop in the ocean compared with the total increase in China’s official reserve assets last year of $419 billion.’”
Source: Julian Jessop, Capital Economics (via Financial Times), April 27, 2009.
The Wall Street Journal: Understanding swine flu “The trouble starts in poor countries where too many people live in proximity to pigs and poultry.
“Unfortunately, conditions in many countries are conducive to the emergence of such new infectious agents, especially flu viruses, which mutate rapidly and inventively. Intensive animal husbandry procedures that place poultry and swine in close proximity to humans, combined with unsanitary conditions, poverty and grossly inadequate public-health infrastructure of all kinds - all of which exist in Mexico, as well as much of Asia and Africa - make it unlikely that a pandemic can be prevented or contained at the source …
“Pigs are uniquely susceptible to infection with flu viruses of mammalian and avian origin. This is of concern for a couple of reasons. First, pigs can serve as intermediaries in the transmission of flu viruses from birds to people. And when avian viruses infect pigs, they adapt and become more efficient at infecting mammals - which makes them more easily transmitted and dangerous to humans.
“Second, pigs can serve as hosts in which two (or more) influenza viruses infecting an animal simultaneously can undergo ‘genetic reassortment’, a process in which pieces of viral RNA (the virus’s genetic material, similar to DNA) are shuffled and exchanged, creating a new organism. The influenza viruses responsible for the world-wide 1957 and 1968 flu pandemics - which killed about 70,000 and 34,000, respectively, in the US - were such viruses, containing genes from both human and avian viruses …
“Because they have been stockpiled for use in the event of an avian flu pandemic, large amounts of the antiflu drugs Tamiflu and Relenza are available. However, they must be administered during the first couple of days after symptoms begin to be an effective treatment. They can also prevent the onset of the disease if administered in adequate doses prior to exposure. The danger of using antiflu drugs in poor countries with inadequate public-health facilities such as Mexico is that they may be administered improperly and in suboptimal doses, which would promote viral resistance and intensify an outbreak.
“If the swine flu outbreak becomes a pandemic with a high rate of severe complications (such as pneumonia) and death, we will need to be smart, nimble and flexible. That will involve triage on many levels - including decisions about which patients are likely to benefit from scarce commodities such as drugs and ventilators - as well as ‘social engineering’ determinations about issues such as mandatory quarantine, the canceling of public events, shutting airports and closing our southern border. Let’s hope it doesn’t come to that.”
Source: Dr Henry Miller, The Wall Street Journal, April 29, 2009.
John Authers (Financial Times): Swine flu “The outbreak of swine fly has barely dented stocks in Mexico, which plainly stands at risk of severe economic damage from a disease that has been linked to the deaths of almost 200 of its citizens.”
Source: John Authers, Financial Times, April 30, 2009.
ETF Trends: Three ETF sectors that could feel impact from swine flu “The swine flu epidemic, which could possibly turn into a pandemic, may not just be a hit to our health. It could also be a major hit to stock markets and related shares of exchange traded funds (ETFs).
“Many are worried about the economic effects of swine flu as it interrupts day-to-day living, travel and purchases. Some countries are already warning their citizens against travel to Mexico and the United States.
“Drug Makers. One beneficiary could be the pharmaceutical industry, though. Certain makers of drugs and vaccines may be caught off guard to the recent epidemic of swine flu, because of commercial orders getting impacted by government stockpile orders from the late avian flu threat.
“Retail & Consumer. Sam Stoval talked to Steve Chiotakis on MarketPlace and reports that the broader economic drawbacks of the swine flu hit upon trade and travel as well as day-to-day purchases. A short-term situation aside, if the outbreak were to remain out of control, consumers are likely to stay at home, which would effect gasoline, oil and energy consumption. Purchases on food and leisure items would dwindle, as well.
“Airlines. In an effort to secure borders and keep the swine flu contained, the United States is now screening for the swine flu at the Mexican border, and Europe’s Health Commissioner urged Europeans to avoid traveling to the United States or Mexico. Could people hold off on travel altogether because of this? According to Richard Aboulafia on MarketPlace, at least a half dozen airlines, including American, United and Continental, are waiving penalties for changing flights to or from Mexico.
“Upon arrival into the United States from an international flight, expect to be screened in customs, including having your temperature taken. Russia, Taiwan and China are all preparing to quarantine anyone with flu-like symptoms.”
Source: Tom Lydon, ETF Trends, April 27, 2009.
CEP News: UK consumer confidence up for the third straight month “Confidence among UK consumers rose for the third straight month in April, according to the latest consumer survey report from the GFK Group.
“According to the report, consumer confidence in the UK improved slightly more than expected in April rising three points to -27. Economists had been expecting a -28 reading.
“The UK consumer confidence survey results were compiled from the responses of approximately 2,000 individuals over the age of 16. The survey was conducted on behalf of the European Commission.”
Source: Erik Kevin Franco, CEP News, April 29, 2009.
CEP News: UK Hometrack Housing Survey moderates slightly in April “The UK housing sector’s decline abated slightly in April, according to the country’s Hometrack Housing Survey, released just after midnight on Monday (Sunday night EDT).
“On a monthly basis, the survey declined by 0.3%. This was less severe than march’s level, which fell an unrevised 0.6%. Hometrack announced that this was the slowest rate of month-over-monthly declines in a year.
“Similarly, the survey’s 10.1% annualized fall was slightly less severe than the prior month’s decline of 10.3%, a level that was also unrevised.”
Source: CEP News, April 26, 2009.
CEP News: Japan’s economy to contract 3.1% in 2009, BOJ says “The Bank of Japan has revised down its economic growth forecasts for the 2009 fiscal year and projects corporate profits and household consumption to weaken further in the coming quarters.
“In its semi-annual economic outlook published on Thursday, the BOJ said it expects the economy to contract 3.1% in the 2009 fiscal year, down from the 2.0% decline previously forecast.
“Earlier in the day, the BOJ’s Policy Board voted unanimously to keep the overnight call rate targeted at 0.1%.
“According to the central bank, domestic private consumption will continue to deteriorate. However, the pace in export and production declines will ease as inventories are adjusted both domestically and abroad.
“‘Therefore, the pace of deterioration in economic conditions will likely moderate gradually and start to level out,’ the central bank said.
“The BOJ also noted that corporate financing conditions had begun to loosen compared to the latter part of 2008 due to improved issuing conditions in both the corporate bond and commercial paper markets.
“‘However, given the deterioration in corporate profits, the situation as a whole remains severe as an increasing number of firms are reporting that their financial positions are weak and lending attitudes of financial institutions are tight,’ the bank added.
“Looking ahead to the 2010 fiscal year, which begins on April 1, 2010, the BOJ projects that the economy will recover to a growth rate of 1.2%, with estimates out of the Policy Board ranging from +0.8% to +1.5%.”
Source: Todd Wailoo, CEP News, April 30, 2009.
CEP News: Japanese manufacturing PMI jumps in April “Manufacturing conditions in Japan improved in April, according to a report from Nomura and the JMMA on Thursday.
“According to a report, the country’s manufacturing PMI advanced to 41.4 from 33.8 in March.
“Although the index remains below the 50 level, which indicates a contracting industrial sector, the figure is well above the 29.6 reading recorded in January.”
Source: Erik Kevin Franco, CEP News, April 29, 2009.
James Pressler (Northern Trust): Japan - deeper into the red “At this early stage in the global recession, most of the industrialized economies are still only speculating when production will turn around or at least stop contracting so rapidly. The US consensus is that growth will return by the end of ‘09, while Europe remains a mixed bag of hard landings and slow recoveries. Today, Japan’s government released a revision of its own outlook, and placed itself amongst the worst-off of the G-7 countries.
“In the government’s latest biannual economic outlook, the fiscal year just ended in March experienced a 3.1% contraction in GDP, while the current FY2009-2010 will experience a sharper slide of 3.3%. The latter figure is a dramatic revision from October’s forecast of 0% growth, and is somewhat more pessimistic than recent statements from Tokyo suggesting a recovery starting in Q1 2010.
“Expectations for exports and business investment were also slashed across the board, with the only positive figure coming from minor growth in public consumption - courtesy of the fiscal stimulus package that came into effect at the beginning of the month. In short, the government has conceded that it will not be able to export its way out of this recession, and eight quarters of contracting GDP (starting in Q2 2008) might even be a little optimistic.
“However, something good may yet come out of all of this - at least for the ruling LDP. PM Taro Aso and his party have not surprisingly taken a beating in the opinion polls over the past six months, and with general elections due this year there was every likelihood that this icon of Japan’s government would be run out of Tokyo entirely. But, a scandal within the opposition Democratic Party (DP) has offered a brief window of opportunity and it appears Aso is pouncing on it. To counter the particularly negative themes of this latest outlook, Aso’s Cabinet is proposing another fiscal stimulus package for FY2010-11. Furthermore, his government submitted a supplementary stimulus package worth ¥15.4 trillion ($159 billion) and all but challenged the opposition-controlled upper house to stall the legislation and force him to call an early election. After being hobbled by scandal, Aso’s dare forces the DP to either roll the dice at the ballot box or cede the economic momentum back to the LDP.”
Source: James Pressler, Northern Trust - Daily Global Commentary, April 27, 2009.
Financial Times: Swiss seek tax treaty trade-off “Swiss and US officials will meet in Bern on Tuesday for their first talks on a new tax treaty after Switzerland asked the Obama administration to drop a legal case involving the Swiss bank UBS in exchange for the accord.
“The talks were announced earlier this month.
“Tim Geithner, US Treasury secretary, this weekend met with Hans-Rudolf Merz, Swiss finance minister and head of state this year under the country’s rotating presidency.
“Mr Merz told Mr Geithner that an aggressive investigation by US tax authorities into accounts at UBS could make it very difficult to secure approval for a new tax treaty in the Swiss parliament and in a referendum.
“‘US officials told the Financial Times that Mr Geithner did not dismiss the importance of appropriately resolving the matter,’ one said.
“However, the official added: ‘Tax treaty negotiations will be conducted by the Treasury Department with input from the Department of Justice and the Internal Revenue Service. All pending enforcement decisions will be made by the Department of Justice and the IRS.’
“The US response suggests it might be possible for the two sides to strike a deal, though the official added: ‘Both President Obama and Secretary Geithner have made very clear their commitment to tackling tax shelters and other efforts to abuse US tax laws.’”
Source: Haig Simonian and Krishna Guha, Financial Times, April 26, 2009.
By Dr Prieur du Plessis
Dr Prieur du Plessis is an investment professional with 25 years' experience in investment research and portfolio management.
More than 1200 of his articles on investment-related topics have been published in various regular newspaper, journal and Internet columns (including his blog, Investment Postcards from Cape Town : www.investmentpostcards.com ). He has also published a book, Financial Basics: Investment.
Prieur is chairman and principal shareholder of South African-based Plexus Asset Management , which he founded in 1995. The group conducts investment management, investment consulting, private equity and real estate activities in South Africa and other African countries.
Plexus is the South African partner of John Mauldin , Dallas-based author of the popular Thoughts from the Frontline newsletter, and also has an exclusive licensing agreement with California-based Research Affiliates for managing and distributing its enhanced Fundamental Index™ methodology in the Pan-African area.
Prieur is 53 years old and live with his wife, television producer and presenter Isabel Verwey, and two children in Cape Town , South Africa . His leisure activities include long-distance running, traveling, reading and motor-cycling.
Copyright © 2009 by Prieur du Plessis - All rights reserved.
Disclaimer: The above is a matter of opinion and is not intended as investment advice. Information and analysis above are derived from sources and utilizing methods believed reliable, but we cannot accept responsibility for any trading losses you may incur as a result of this analysis. Do your own due diligence.
Prieur du Plessis Archive |
© 2005-2022 http://www.MarketOracle.co.uk - The Market Oracle is a FREE Daily Financial Markets Analysis & Forecasting online publication.