


Stocks Bear Market Rally or New Bull Market?
Stock-Markets / Stocks Bear Market May 06, 2009 - 12:20 AM GMTBy: Guy_Lerner

 Since the equity markets bottomed on March 9, I have always been very careful to point out that the current rally is a bear market rally. In other words, when all is said and done, I believe that the current intermediate uptrend will be viewed as counter trend rally within an ongoing bear market. It has been my expectation that the current intermediate up trend has a high likelihood of rolling over in the next couple of weeks.
With the market's recent lift, I have received several emails asking me: when will I throw in the towel and call this a new bull market?
Traditionally, many define bull and bear markets as a percentage gain or loss from a certain point. For example, a 20% gain from the bottom would be a new bull market. By this measure over the past 12 months, we have had 2 bear markets and 2 bull markets when considering the price action in the S&P500. This is kind of silly, and for my purpose, this is not a particularly useful metric. Then again embracing the "traditions" of Wall Street is not the way to make money.
So how will I define a new bull market? In other words, when will I give up on this bear market rally nonsense, declare the bear is dead and start embracing the "bull" and this rally?
Let me take you through my process of how I would define a new bull market. From a technical perspective, I like to see the market get into a "position" that has the potential to launch a new bull market. In other words, the "next big thing" indicator has to cycle into position or the price action has to consolidate into a narrow trading range.
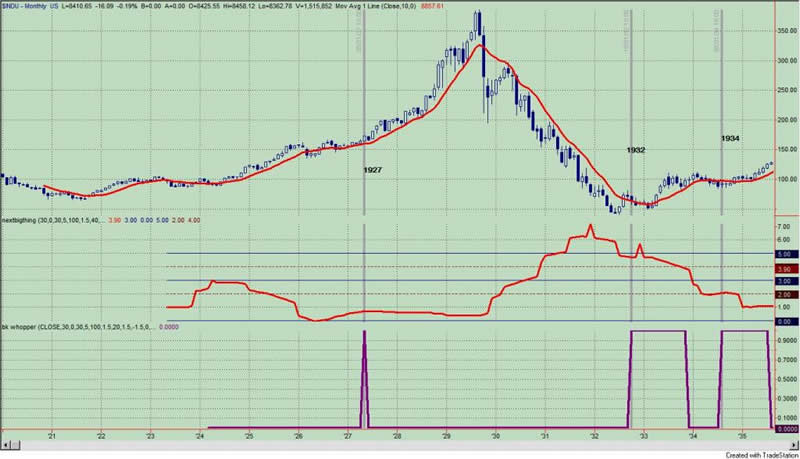
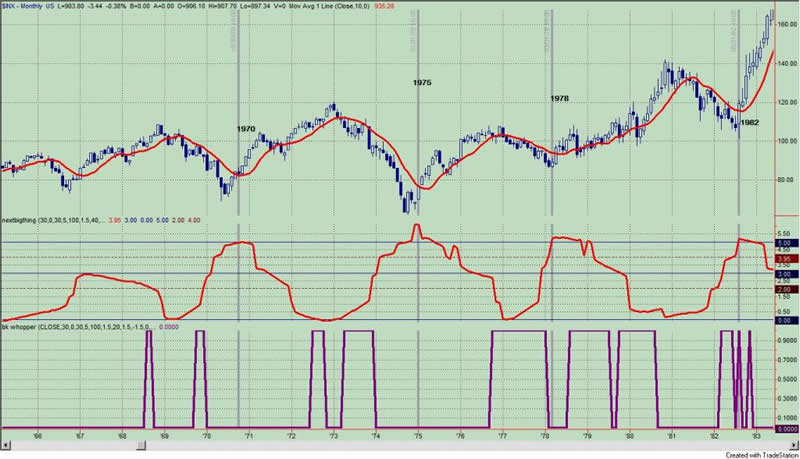
Why do I want this to happen? Because from 1927 to the present, every major move but one in the Dow Jones Industrial Index has seen 1 of 2 things occur from a price perspective: 1) the "next big thing" indicator cycles into the alert zone where there is a high likelihood of new secular trend occurring; or 2) prices went through a prolong consolidation period before heading higher. This can be seen in the next series of figures, which show every major market bottom in the $DJIA going back to 1927. The "next big thing" indicator is in the middle panel, and the indicator in the lower panel looks for statistically relevant consolidation in prices. These are the launching pads to a new bull market. There has been only exception and this was the 1963 bottom.
Figure 1. DJIA/ monthly
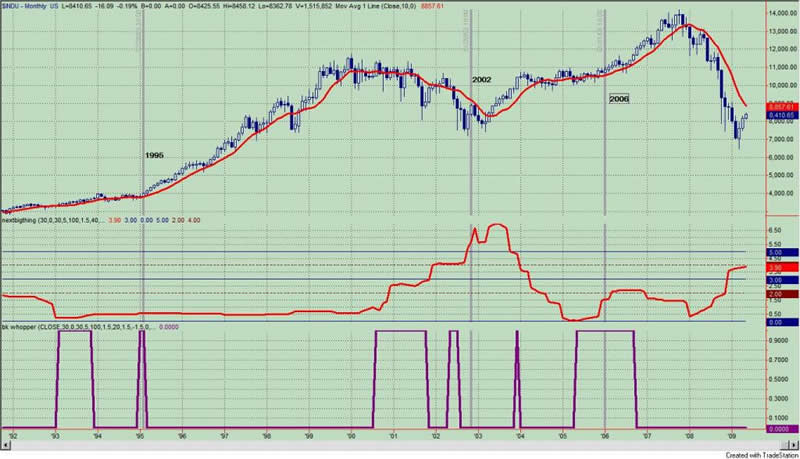
Figure 2. DJIA/ monthly
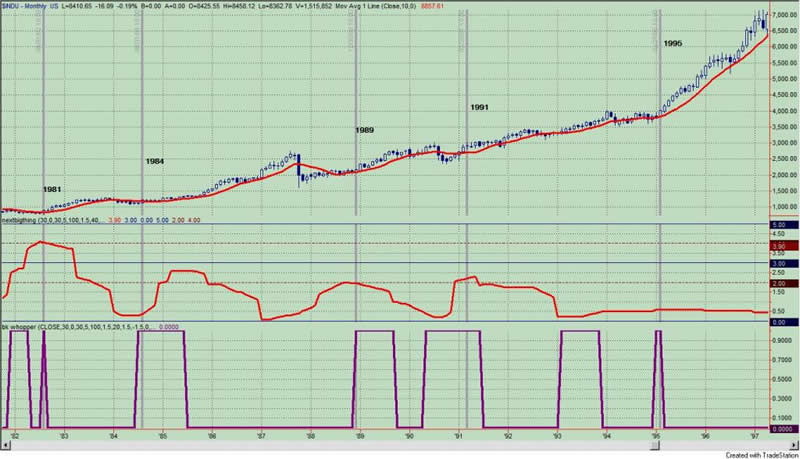
Figure 3. DJIA/ monthly
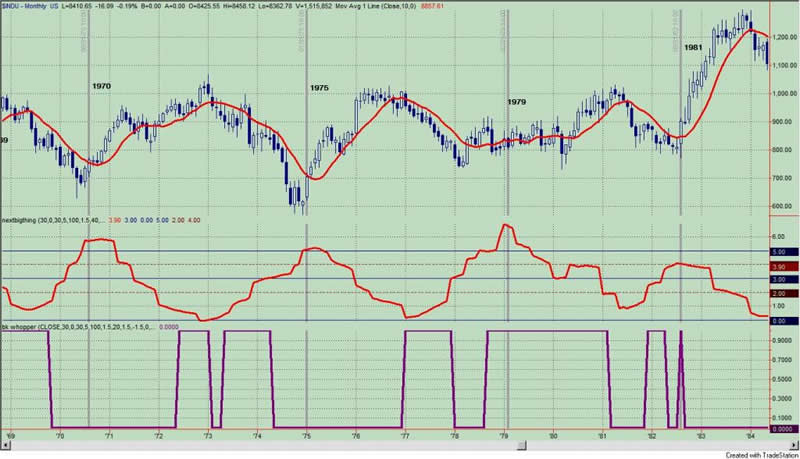
Figure 4. DJIA/ monthly
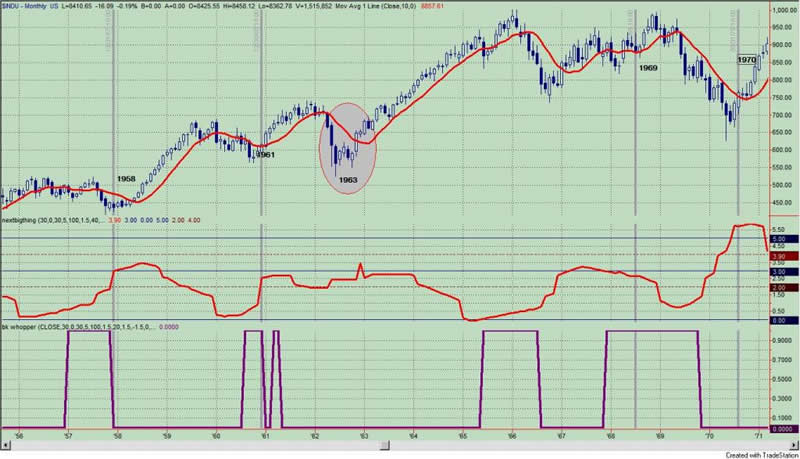
Figure 5. DJIA/ monthly
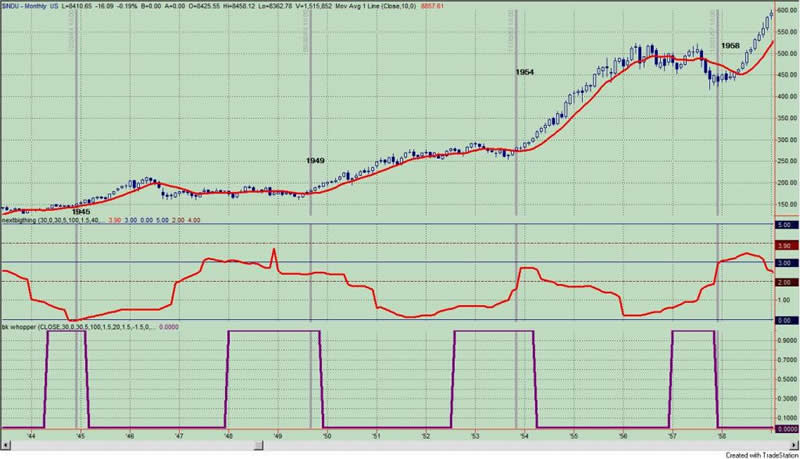
Figure 6. DJIA/ monthly
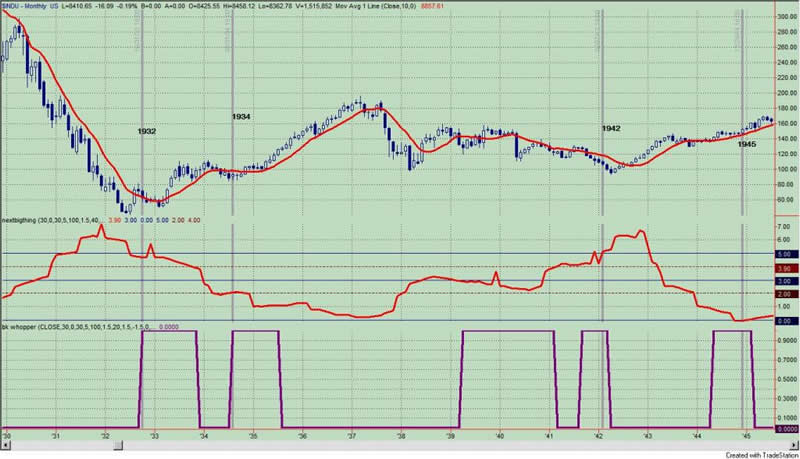
Figure 7. DJIA/ monthly
Don't like the Dow? So let's look at the S&P500 going back to 1970.
Figure 8. S&P500/ monthly
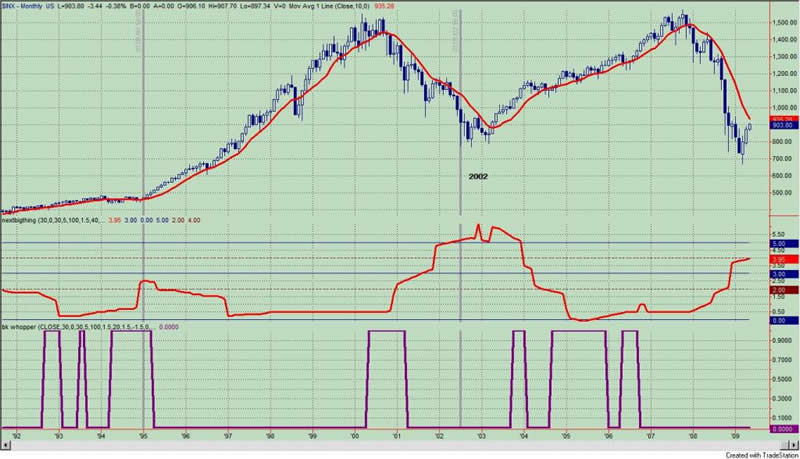
Figure 9. S&P500/ monthly
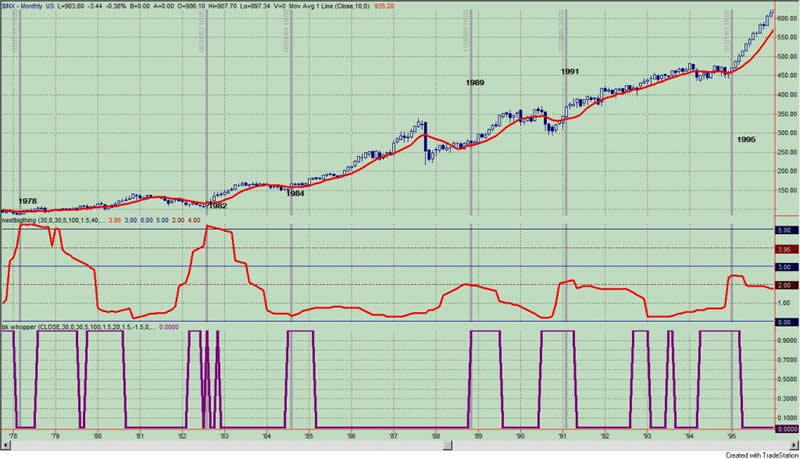
Figure 10. S&P500/ monthly
This is pretty consistent stuff across multiple asset classes (although I have only shown equities here), and all I am trying to do is identify the potential for a secular trend change in an asset. These indicators don't identify market bottoms. They identify the possibility for secular trend change, and being with the longer term trend is very, very important to success in the markets.
So once I identify an asset about to undergo a secular trend change, then I look for technical patterns to enter into that market, and these could be as simple as a monthly close over the simple 10 month moving average. I did allude to several "set ups" in these two articles: 1) "4 Sectors That Could Be The Next Bull Market Leaders" ; and 2) "Add These 2 Sectors To Your Watchlist".
So Why No Bull Market?
Neither the Dow Industrials, S&P500, NASDAQ, or NASDAQ 100 is in a position to undergo a secular trend change. They are close but still it is no cigar. On the other hand, the Russell 2000 has entered that potential zone last month, and this can be seen in figure 11.
Figure 11. $RUT.X/ monthly
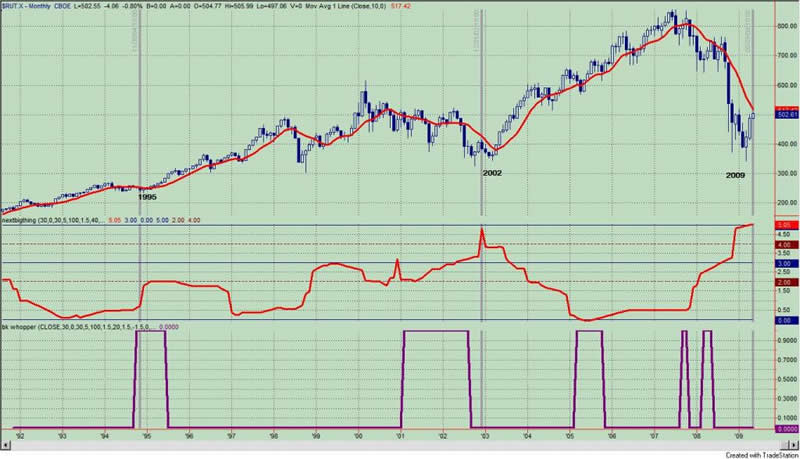
So this is my first concern about the current rally. The markets just aren't ready for a new up trend. This is not the launching pad for a new bull market.
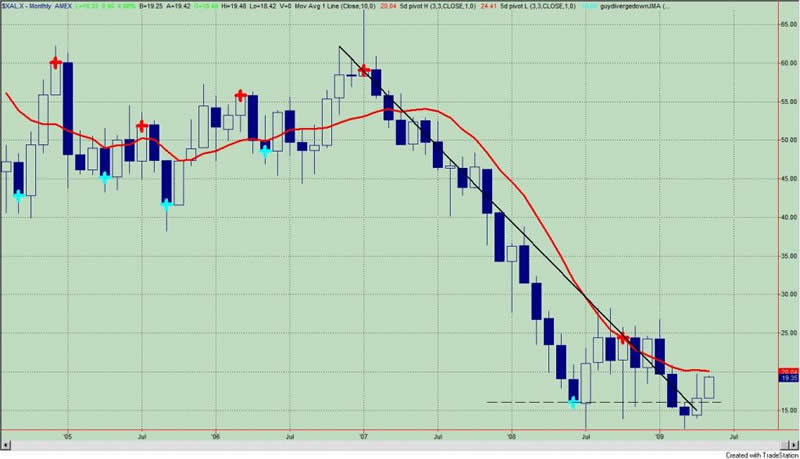
My second reason for not making the bull market call has to do with the structure of the price action itself. In most instances of a market bottom, I can find a prior pivot point that has acted as resistance, and prices will trade below and then above this key level thus confirming the turn in the market from bear to bull. Or there is a close above a down trend line formed by two prior pivot points. The monthly chart of the AMEX Airline Index (figure 12, symbol: $XAL.X), which I highlighted several times this past month, is an example of a close above a prior pivot low point and above a down sloping trend line.
Figure 12. $XAL.X/ monthly
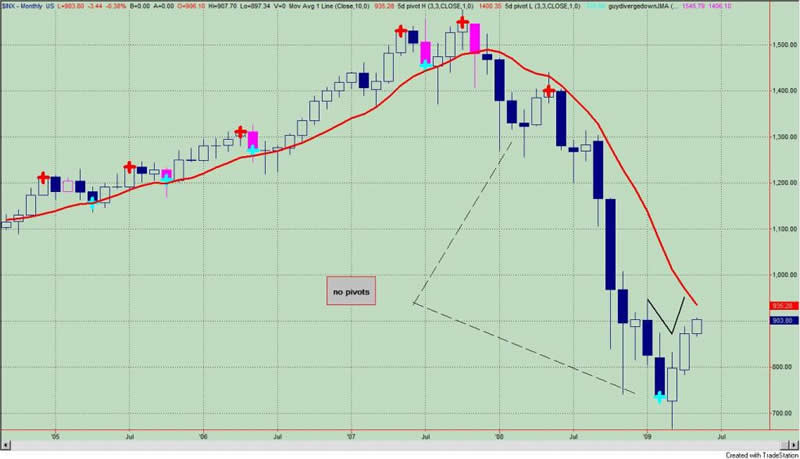
Since the market top in October, 2007, the price action has been more of unraveling than a stair step down. Essentially, there are no pivot points from which I can gauge the current price action. See figure 13 a monthly chart of the S&P500. All I can say about the last three months is that it is looking very "V" like.
Figure 13. S&P500/ monthly
Summary
I have provided you with two criteria that I would like to see before I make "the call" that we are in a new bull market. Presently, these conditions have not been met, so in my book, this is still a bear market rally.
Yet I know that Mr. Market doesn't usually consult with me, and I am well aware that a bull market can start without my criteria being met. The market seems to have a way of spoiling the best of plans. So I still must be prepared for the possibility that my indicators and tools just aren't sensitive enough to detect a new bull market.
If this turns out to be the case, then I would "throw in the towel" if the S&P500 closed about its simple 10 month moving average on an end of month closing basis. Mebane Faber, from the World Beta Blog, has presented a very simple (yet effective) timing system that utilizes the simple 10 month moving average. If the S&P500 were to keep rising and print a monthly close above its simple 10 month moving average, then I would call this a new bull market. I will also point out that no major index has yet to end the month above its simple 10 month moving average.
Until then, I still believe we are in a bear market. Until my indicators give the signal, I still don't believe the potential for a new bull market exists. The possibililty of a new bull market is always present, but the probality at this point in time seems rather remote.
By Guy Lerner
http://thetechnicaltakedotcom.blogspot.com/
Guy M. Lerner, MD is the founder of ARL Advisers, LLC and managing partner of ARL Investment Partners, L.P. Dr. Lerner utilizes a research driven approach to determine those factors which lead to sustainable moves in the markets. He has developed many proprietary tools and trading models in his quest to outperform. Over the past four years, Lerner has shared his innovative approach with the readers of RealMoney.com and TheStreet.com as a featured columnist. He has been a regular guest on the Money Man Radio Show, DEX-TV, routinely published in the some of the most widely-read financial publications and has been a marquee speaker at financial seminars around the world.
© 2009 Copyright Guy Lerner - All Rights Reserved
Disclaimer: The above is a matter of opinion provided for general information purposes only and is not intended as investment advice. Information and analysis above are derived from sources and utilising methods believed to be reliable, but we cannot accept responsibility for any losses you may incur as a result of this analysis. Individuals should consult with their personal financial advisors.
Guy Lerner Archive |
© 2005-2022 http://www.MarketOracle.co.uk - The Market Oracle is a FREE Daily Financial Markets Analysis & Forecasting online publication.