


JPM “Tentative” On Balance Volume Sell Signal
Companies / Technical Analysis May 12, 2009 - 02:51 AM GMTBy: Brian_Bloom

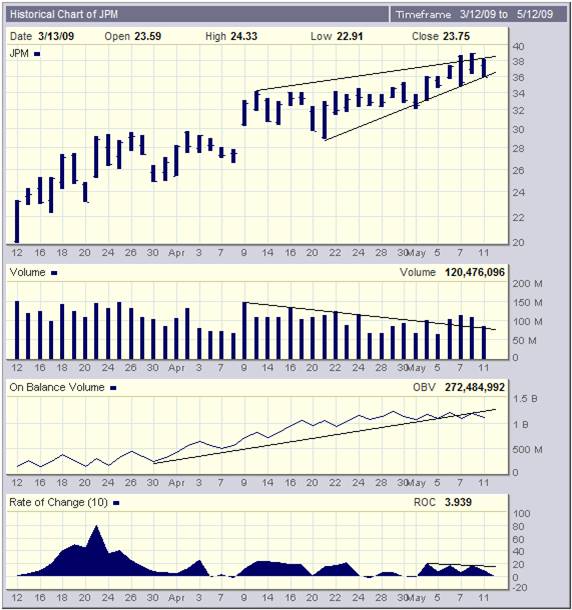
 In terms of Joseph Granville’s original argument, an On-Balance-Volume sell signal needs to manifest as a saw-tooth pattern, i.e. There needs to be a lower low following on from falling highs. This has not yet happened. (See second chart)
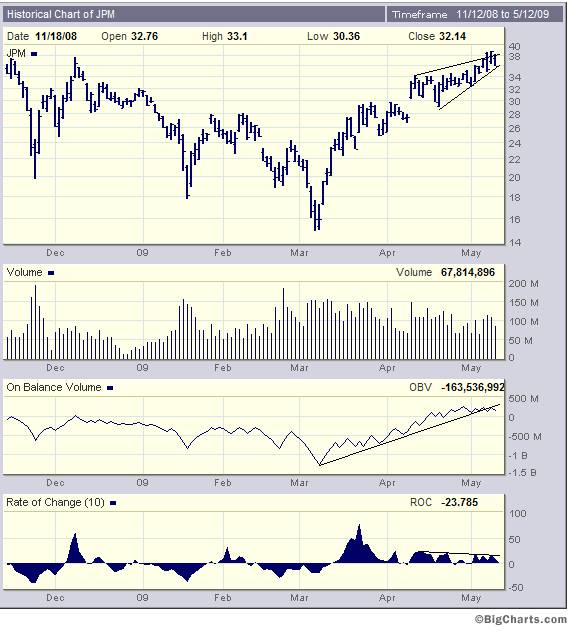
However, it may well happen in context of other developments which may be leading indicators. The charts below (courtesy BigCharts.com) are showing the following tentative signs of bearishness:
- The “false” break up out of the rising wedge has now reversed, although there has been no sell signal yet
- The rising wedge emerged after an upside gap which has not yet been fully covered. The price needs to fall to $28 for that to happen.
- There has been a sideways penetration of the rising trend line on the OBV
- The Rate of Change (ROC) chart is showing a series of three falling tops. Usually, following this type of pattern, it turns negative.
- The rising prices within the rising wedge occurred within the context of falling volume (except for the false breakout – which might well have been engineered)
Below is a P&F chart (3% X 3 box reversal) of JPM, courtesy StockCharts.com
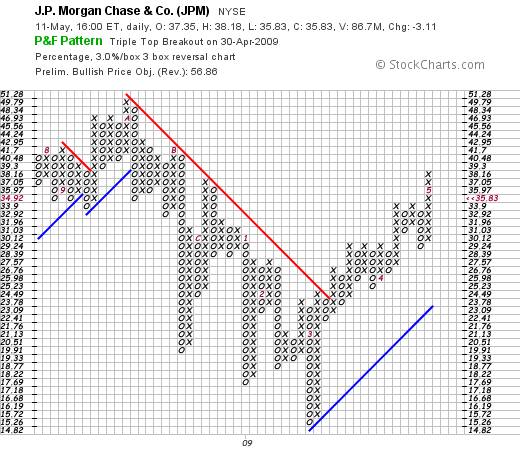
It needs to be emphasized that the April 30th “buy” signal in the chart above should be treated with extreme caution if the Primary Trend of the market is “down”.
Technically, the gap in the second bar chart above needs to be covered. If it is covered at 28, then the most recent bull move will not only be negated, a new sell signal will manifest which will give rise to a downside target of between 25.23 (horizontal count target) and 22.4 (vertical count target). Further, if the Primary Trend is indeed down, then the vertical count is the more believable target.
But 22.4 – should it be reached – will represent a breakdown through the rising blue trend line.
It can be seen from the following chart (5% X 3 box reversal) that if the blue trend line in the chart above is penetrated on the downside, the price could fall all the way back to 15.08 based on the vertical count target below.
Conclusion
This is a VERY dangerous market! The integrity of a technical (trading) signal is dependent on the direction of the Primary Trend, and there is a raging debate regarding whether the old Primary Bear Market has ended and a new Primary Bull Market has commenced. The majority of day traders and technicians out in the market today have never lived through a savage bear market. Those who are managing “Other People’s Money” are predisposed to blindly believe the technical (computer algorithm and chart) signals which are telling them what they want to hear – which is why there has been so much volatility. The “rush” into the market in recent weeks has had an SOS feel to it.
Author’s note
I have tried to be as clear and as articulate as possible in the past few weeks. Based on fundamentals (underlying values) it is my view that there is no way that we are entering a new Primary Bull Market. In my view, what we are experiencing is a technical reaction within a Primary Bear Market. Current share prices are discounting future corporate earnings two years into the future – assuming the economy doesn’t unravel from here. Share prices will not rise for any “logical” reason in the face of this fact and it is very hard to make a case for an economy which is going to get back to “business as usual” in the foreseeable future. For example, GM closing 2600 dealers – which is 42% of its total supply chain – and the likely brouhaha litigation that will follow – is certainly not a bullish development. (Source: http://www.thetruthaboutcars.com/gm-declares-war-on-gm-dealers/ ) For example, That the Fed has been forced to buy treasuries because there are not enough takers for the US’s confetti debt is certainly not a bullish development. Trying to keep interest rates from rising under conditions where the Fed is now, literally, printing money will be like pushing on a string. Rates will rise and the dollar will fall if the Fed continues to print money, and rates will rise if they stop buying the US’s confetti debt. In short, rates will rise over time because “time” has now become the enemy.
None of this will be good for the derivatives industry and the reason I have been focusing on JPM in recent weeks is that they are the largest player, world-wide, in the derivatives industry and the majority of their risk exposure is “off balance sheet”. The typical argument relating to derivatives is this: “We don’t know whether we are going to make a profit or a loss on these instruments, so how can we show them as either an asset or a liability on our balance sheet?” Until the answer to that question is known, JPM must be judged to be reasonably well capitalized – which is almost certainly why it passed the stress test. But I am the proverbial “reasonable man”. No reasonable man will accept that the world’s largest player in the derivatives industry is going to come face-about into the headwinds of rising interest rates and a falling dollar and not get dashed onto the rocks.
Here are two of the risks being faced by JPM:
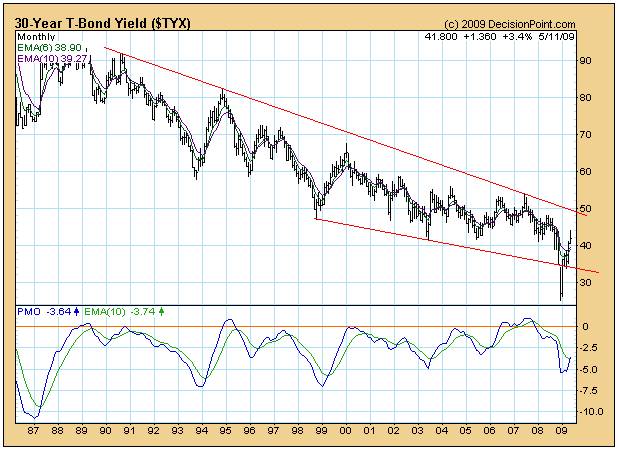
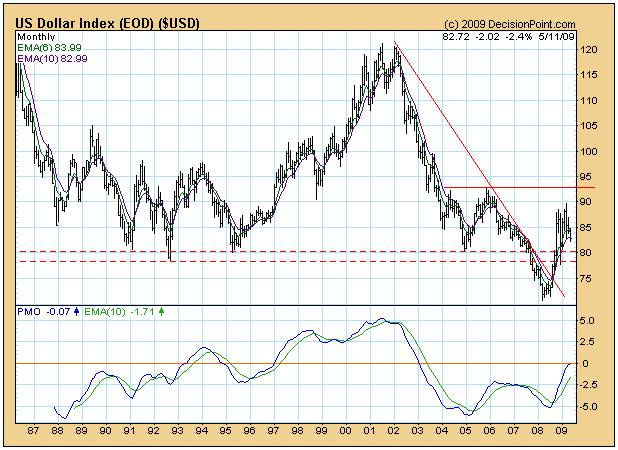
The charts above show that yields are wanting to bottom out and that the dollar is wanting to roll over and head south.
Can this be averted? Of course anything is possible and, if the authorities are going to fail to avert a catastrophe, it won’t be for want of trying. That’s why the chart of JPM is so important.
By Brian Bloom
Beyond Neanderthal is a novel with a light hearted and entertaining fictional storyline; and with carefully researched, fact based themes. In Chapter 1 (written over a year ago) the current financial turmoil is anticipated. The rest of the 430 page novel focuses on the probable causes of this turmoil and what we might do to dig ourselves out of the quagmire we now find ourselves in. The core issue is “energy”, and the story leads the reader step-by-step on one possible path which might point a way forward. Gold plays a pivotal role in our future – not as a currency, but as a commodity with unique physical characteristics that can be harnessed to humanity's benefit. Until the current market collapse, there would have been many who questioned the validity of the arguments in Beyond Neanderthal. Now the evidence is too stark to ignore. This is a book that needs to be read by large numbers of people to make a difference. It can be ordered over the internet via www.beyondneanderthal.com
Copyright © 2009 Brian Bloom - All Rights Reserved
Disclaimer: The above is a matter of opinion provided for general information purposes only and is not intended as investment advice. Information and analysis above are derived from sources and utilising methods believed to be reliable, but we cannot accept responsibility for any losses you may incur as a result of this analysis. Individuals should consult with their personal financial advisors.
Brian Bloom Archive |
© 2005-2022 http://www.MarketOracle.co.uk - The Market Oracle is a FREE Daily Financial Markets Analysis & Forecasting online publication.