


Has the U.S. Housing Market Made a Bottom?
Housing-Market / US Housing Jun 10, 2009 - 06:56 PM GMTBy: Hans_Wagner

 Listening to the news and reading the headlines would make you believe the economy is recovering and the good times will come in the not to distant future. After all home sales rose 0.3% in April and all those green shoots are sprouting. Many analysts are stating we have seen the bottom in housing. That would be good news indeed. For housing was the major culprit of the latest recession. However, a look at the detail does not indicate a bottom is here yet.
The charts below are from calculatedriskblog.com, a great site for insight on finance and the economy. I encourage you to check them out. Moreover, I believe pictures tell a great story.
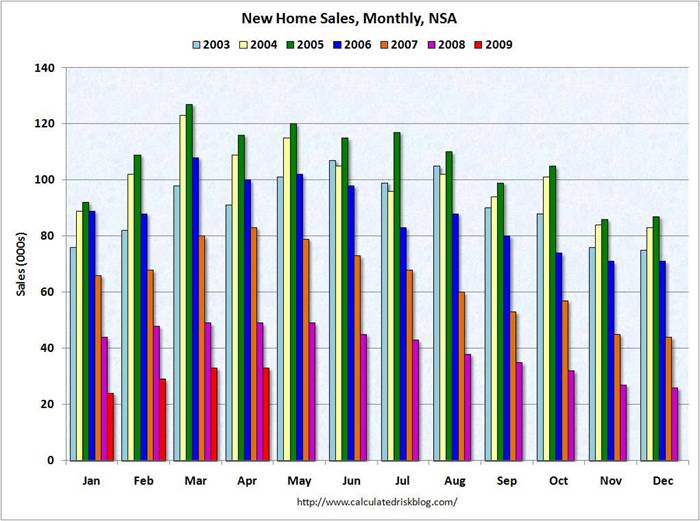
As shown in the chart new home sales did rise. This is April when new homes sales always rise as people start to buy homes. If we did not get a rise, it would be really bad news. As it is, a 0.3% rise is not very good. In April 2008, in the middle of the plunge in housing, new homes sales were flat much like this year. In addition, this number is subject to revision that can be substantial, so we could see a lower number. We need to see what happens in the next couple of months before we can claim that housing has bottomed.
The contraction in new home sales draws a parallel to a decline in the number of new mortgages written by the financial sector. No wonder the banks are not able to generate more loans that are new. The demand from the mortgage side keeps falling.
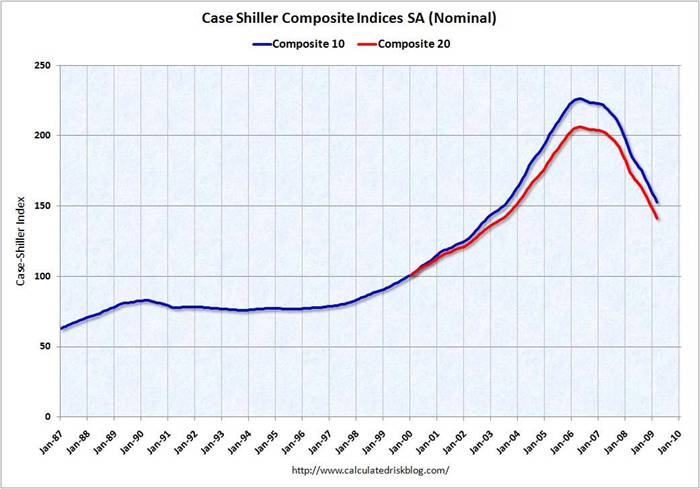
The S&P Case-Shiller Index for home prices continues to trend down. These indexes cover the top 20 market areas. As long as home prices keep trending down, it will delay the recovery in the housing market and with it the recovery in the economy. One observation is home prices are likely to overshoot to the down side before finally recovering.
 7
7
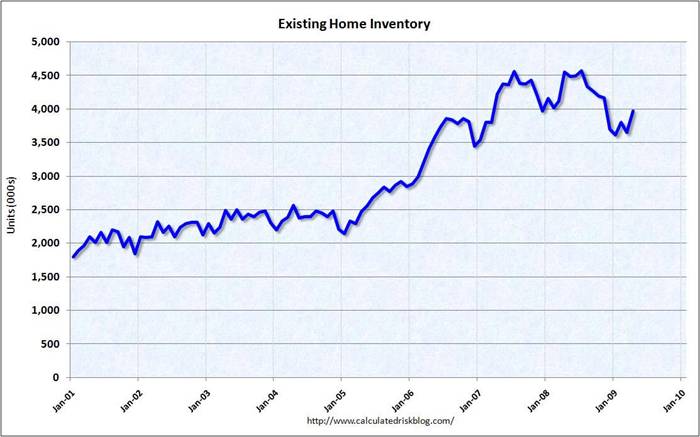
The level of available inventory will be key to the bottom in home prices. As shown in the chart from the National Association of Realtors, inventory increased to 3.97 million in April typically inventory rises in the spring, peaking in the summer months as more home owners and builders bring homes on the market for the buying season. Summer is the best time to buy a home or move as that is when the kids are out of school and the weather is more conducive to looking for homes.
Some of the homes owned by banks, called OREO (Other Real Estate Owned) can be included in the list of homes for sale. Many others including foreclosures underway are not, so the number is not a true picture of what is available. In addition, many people have held off selling their homes, waiting for the market to improve. These homes will come on the market over the next few months and years depending on their individual situation. We have no measure of the size of this shadow inventory, but I suspect it is quite large.
As a result, the turn up in home prices will have to wait until the total available inventory of homes comes down to more sustainable levels. Investors should be careful when they read that the housing market has found a bottom when inventories remain so high.
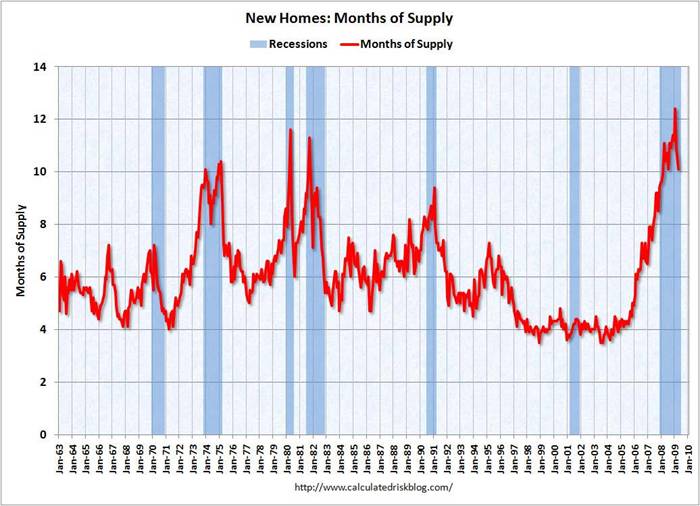
One way to measure what is a reasonable level of inventory is how many months it takes to sell the available inventory of homes at the current sales rate. The chart below shows the months of supply of new homes that are available. A normal range is four to six months. At ten months of available supply of new homes, we have a ways to go. Add in the competition form existing homes and the shadow inventory and it is likely to take a year or two before we see a return to normalcy.
Once again, investors should remain cautious that the housing market has turned the corner as indicated by some of the headlines. The market anticipates changes in the economy by up to six months. It also misjudges news items for fundamental changes creating false hopes. This is one of those times.
It always pays to look deeper into the news we hear and the headlines we read. Many people are inherently optimists, so they will grab any piece of good news. However, the economy will reflect what is really going on over time. Being the first one to jump on a bad wagon that the bottom is here usually just adds to the weight carrying it further down. It is better to be sure we have arrived at the bottom before getting on board. There will be plenty of time to catch the ride up when it really begins.
By Hans Wagner
tradingonlinemarkets.com
My Name is Hans Wagner and as a long time investor, I was fortunate to retire at 55. I believe you can employ simple investment principles to find and evaluate companies before committing one's hard earned money. Recently, after my children and their friends graduated from college, I found my self helping them to learn about the stock market and investing in stocks. As a result I created a website that provides a growing set of information on many investing topics along with sample portfolios that consistently beat the market at http://www.tradingonlinemarkets.com/
Copyright © 2009 Hans Wagner
Hans Wagner Archive |
© 2005-2022 http://www.MarketOracle.co.uk - The Market Oracle is a FREE Daily Financial Markets Analysis & Forecasting online publication.