Stock Market Price Charts Can be Confusing ... Can't They?
Stock-Markets / Technical Analysis Jul 07, 2009 - 03:18 PM GMTBy: Marty_Chenard
 Take the Relative Strength for example. It moves from zero to 100. The half way point has to be ascertained visually, because 50 is a critical level. So, you have to watch for 51 or 49 to know when you are above or below that critical mark.
Doesn't it just make more sense to subtract 50 from the index and calculate a new index based on that?
For example: A RSI reading of 50 (neutral) minus 50 would reset the the base line to zero. So zero would become the base line, and any movement above or below it could be seen visually without even looking at the number. That is why we reset many indicators to a zero base ... so we can see them fast and efficiently without any required interpretation.
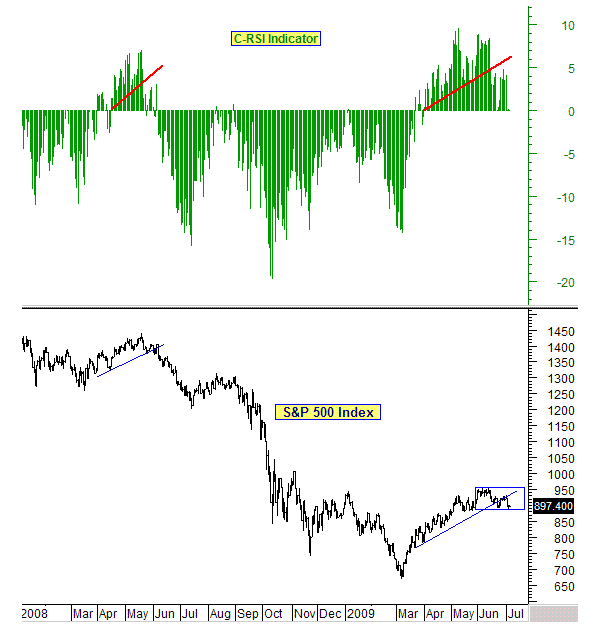
So, that is how our C-RSI Indicator was born. Today's C-RSI vs. the S&P chart is very interesting and clearly shows where we are in this rally cycle.
Take a look at the posted C-RSI chart below. There were 2 decent upside rallies since 2008 and our C-RSI was trading positive (above zero) for both rallies.
Both of these rallies ran into trouble when the C-RSI fell below its red support line. The first one ran a positive C-RSI from April 2008 to June 2008. In late May 2008, the red C-RSI support line was broken to the downside, but it wasn't until June 2008 that the C-RSI finally went negative ... and that is when the S&P went into a correction.
So, let's look at the current rally again. Our C-RSI indicator has been positive since the end of March. On June 15th. the first "crack" appeared when the C-RSI fell below its support line. Check your own charts ... the market has essentially gone nowhere since June 15th.
The positive right now, is that the C-RSI has not gone into negative territory ... at least as of yesterday's close. But, the reality is also that "risk levels" are substantially elevated when the C-RSI is below its red support line and "testing" its zero line ... so, now is a good time to be cautious.
(Note: The C-RSI is posted in many charts on our paid subscriber sites every day. Today's C-RSI chart is being shown as a courtesy to our free members today.)

________________________________________________
*** Feel free to share this page with others by using the "Send this Page to a Friend" link below.
By Marty Chenard
http://www.stocktiming.com/
Please Note: We do not issue Buy or Sell timing recommendations on these Free daily update pages . I hope you understand, that in fairness, our Buy/Sell recommendations and advanced market Models are only available to our paid subscribers on a password required basis. Membership information
Marty Chenard is the Author and Teacher of two Seminar Courses on "Advanced Technical Analysis Investing", Mr. Chenard has been investing for over 30 years. In 2001 when the NASDAQ dropped 24.5%, his personal investment performance for the year was a gain of 57.428%. He is an Advanced Stock Market Technical Analyst that has developed his own proprietary analytical tools. As a result, he was out of the market two weeks before the 1987 Crash in the most recent Bear Market he faxed his Members in March 2000 telling them all to SELL. He is an advanced technical analyst and not an investment advisor, nor a securities broker.
Marty Chenard Archive |
© 2005-2022 http://www.MarketOracle.co.uk - The Market Oracle is a FREE Daily Financial Markets Analysis & Forecasting online publication.


