


The Recession is Over, What to Do Now
Stock-Markets / Recession 2008 - 2010 Aug 01, 2009 - 04:31 AM GMTBy: Q1_Publishing

 One of the most watched indicators just flashed the “sell” signal…
What are you going to do?
Pull out of the market and hope you aren’t stuck on the sidelines watching everyone else get rich?
Stay “long and strong” and hope the market rally continues?
It’s a tough choice. But if we look at this one popular indicator, what it tells us about the prospects for stocks, and use one ultra-simple, protective investment strategy, you won’t have to choose at all.
The Contrarian Indicator Says Sell
Earlier today one of the most widely watched indicators flashed and raised a lot of red flags for investors.
I’m talking about the latest edition of Newsweek.
This week’s issue proclaimed the, “The Recession is Over!” (see picture)
 Big surprise, right?
The S&P 500 has rallied 48% from its March lows. The market has to be seeing something better than it did a few months ago.
One of those things the market is seeing is earnings. This earnings season has reignited the rally. It has been an opportunity for the world’s most creative accountants to show how well their companies have been able to deal with the economic downturn.
All seemed well…until today when Newsweek sounded the “all clear.”
You see, the “Magazine Cover Indicator” is one of the most popular contrarian indicators in the world.
It’s Just Business
The reason it’s a contrarian indicator is because magazines are a business. They are in the business of selling stuff people want to read. They make money by publishing what people want to know about.
As a result, they make the most money (in the short-term at least) by providing information that people want to know about, not necessarily information the readers should know about.
For instance, this week’s cover story is compelling. It hits directly on what most people are thinking right now.
Think about how many people are thinking, “Sure, the recession is over, the stock market is rising, and everyone is saying how great it is, but it sure doesn’t feel like it’s over for me.”
An article like this – which goes out right after everyone is questioning the recovery - is bound to attract a lot of attention for Newsweek. This issue is going to sell well.
However, when using it as an investment indicator to help us decide what move to make right now, I think about the words of Max Guenther. In Zurich Axioms, an excellent book on successful speculation and one of the must read books for successful investing, he reminds us, “Disregard the majority opinion as it is probably wrong.”
That’s why the Magazine Cover Indicator is a contrarian indicator. Of course, we have to be concerned about the timeliness of it all.
 The Truth About Magazine Covers
As with all indicators, the magazine cover one is far from as perfect as it is commonly held out to be.
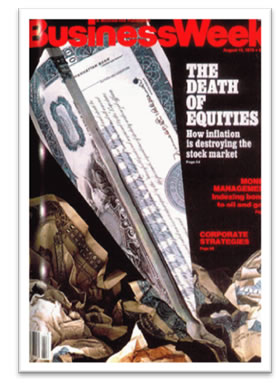
For example, one of the most cited magazine covers in the investment world is the August 13, 1979 edition of Businessweek.
In that issue the business magazine proclaimed the “Death of Equities.”
Who could blame them?
The Dow closed at 896 that week - 15 years from when the index hit 896 in 1964. Stocks went nowhere for 15 years, inflation was in the double digits pushing bond yields right up with them, and the extended bear market turned a lot of investors off. No one wanted anything to do with stocks and Businessweek was providing what its customers wanted.
Looking back, 1979 would have been a great time to take a contrarian approach to “the death of equities” and start buying stocks. Had you bought the Dow in 1979 and held until 1999, you would have made 13 times your money. Even if you had terrible timing and sold out at the market bottom 2002, you still would have made more than 10 times your money.
But here’s the thing. If you would have followed the magazine cover indicator and made the contrarian move, you would have had a long wait and a very volatile road ahead of you.
For example, the “Death of Equities” issue came out in August, 1979 when the Dow was at 896. Over the next eight months, the Dow would continue to fall. By April 1980 the index had fallen to763. That’s 15% decline - or the equivalent of the Dow falling back to 7800 by next March.
The action didn’t stop there either. The Dow climbed from its 1980 lows 33% on its way to 1,020 by April 1981. Again, the market anticipated the recession to be over. It was technically right (the 1980 recession did end), but a much bigger recession lurked around the corner.
The next recession sent the Dow back down to its 1979 lows by August of 1982 at 784. That’s not much higher than it was in 1980 and it was still 12% lower than when Businessweek declared the Death of Equities three years earlier.
So that’s the real story on the Magazine Cover Indicator. It works, but it takes a long time – a very long time - for it to pay off. The most cited case took three years to be right. Think back 30 years, three years doesn’t seem like much. But thinking ahead to 2012 seems like a very long time.
So please, take the magazine cover indicator for what it is. It’s an indicator of broad perception and long-term trends. It’s not good at all for short-term use.
Is it 1964, 1980, or 1982?
Make no mistake about it, I’m confident when we look back in 10 or 20 years, “The Recession is Over” cover will be looked back on as a great contrarian indicator. There are just so many structural issues and misaligned resources that it’s going to take years to work though them. Then add to the mix all the government “fixes” that are preventing genuine economic healing and are actually going to make the next downturn more severe (we’ll look at the how, why, and how to profit from it in the next Prosperity Dispatch) and you’ve got the recipe for a very long period of economic stagnation ahead.
But hey, we’re dealing with the markets here. And the market anticipates what’s going to happen in the short-term. And right now, the short-term is for GDP growth to resume in the fourth quarter, job losses to slow even more, and for all the new money handed out by governments around the world to have positive impact in the next few months. Possibly, even through the next year or so.
So with that in mind, when it comes to either A) Selling out and running for the sidelines; or B) Staying “long and strong” and hoping for more gains, I’d have to say both are terrible options.
It’s time to make yourself and option “C.” That would include staying focused on reality, looking for new positions with the best risk/reward characteristics, mastering strategies which work great in this kind of market environment, and tightening up those stop-losses.
By sticking to option C), we’ll be in perfect position whether it’s 1964 all over again and we have 15 years of a volatile road to nowhere. Or it’s 1980 and we’re in the midst of a giant “head fake” rally. Or the recession really is over and it’s 1982 and there the bottom is in and the sky’s the limit.
Good investing,
Andrew Mickey
Chief Investment Strategist, Q1 Publishing
Disclosure: Author currently holds a long position in Silvercorp Metals (SVM), physical silver, and no position in any of the other companies mentioned.
Q1 Publishing is committed to providing investors with well-researched, level-headed, no-nonsense, analysis and investment advice that will allow you to secure enduring wealth and independence.
© 2009 Copyright Q1 Publishing - All Rights Reserved
Disclaimer: The above is a matter of opinion provided for general information purposes only and is not intended as investment advice. Information and analysis above are derived from sources and utilising methods believed to be reliable, but we cannot accept responsibility for any losses you may incur as a result of this analysis. Individuals should consult with their personal financial advisors.
Q1 Publishing Archive |
© 2005-2022 http://www.MarketOracle.co.uk - The Market Oracle is a FREE Daily Financial Markets Analysis & Forecasting online publication.